
Knowledge Base
Articles In This Section
How Workato Actually Works: A Simple BreakdownWorkato Workflow Apps: A Complete OverviewHow to Build Your First Recipe in Workato Understanding Webhooks in WorkatoWorkato FAQs: The Ultimate List of Common Workato FAQsHow to Sync your SurveyMonkey Data within Quickbase using WorkatoWhat is WorkatoUnderstanding Workato Custom Connectors How to use Workato's Logging SystemHow to use GitHub Secret Scanning for your Workato Developer API10 Key Benefits of WorkatoHow to Use Workato to Send an Email through Outlook What is Workato ONEHow to Connect Workato to RingCentralHow to Set Up HTTP Requests in Workato: Built-in and Custom What is an MCP Server and Why It Matters for your AI Foundation How to Build a Workato Center of ExcellenceHow to use Data Tables in Workato: Step-by-Step GuideHow to Use Conditional Actions in Your Workato Recipe How to Set Up a Call Ended Trigger in Workato for RingCentralHow to Create a New App Connection in WorkatoWhat is Workato ONEHow to Set Up HTTP Requests in Workato (Built-in and Custom)How to use Data Tables in Workato: Step-by-Step GuideHow to Manage API Clients and Client Roles in WorkatoHow to Process File Attachments in WorkatoSections
Getting Started with Data Orchestration in Workato
Workato offers a powerful and flexible platform for data orchestration designed to streamline your data orchestration processes while maintaining simplicity.
As a platform that supports hyper-automation, Workato enables users to accomplish a wide range of tasks while offering a seamless building experience and user interface (UI). This empowers citizen builders to build data orchestrations, without sacrificing on robust data orchestration capabilities.
Workato enables you to build effective data pipelines that can combine and harmonize data from different sources, applications, and systems within your organization, transform the data, and load it to databases or data warehouses to gather insights that can help to better understand your business and customers.
How to Monitor Orchestration Activity in Workato
Go to Platform > Data Orchestration to open the data orchestration dashboard. You can use this dashboard to monitor pipeline run status and duration, and troubleshoot data ingestion pipelines.
- This dashboard displays historical activity, run outcomes, and data volume metrics across orchestration workflows in your workspace.
- The dashboard currently supports data ingestion pipelines and selected connectors in recipes and it does not currently display activity from other pipeline types.
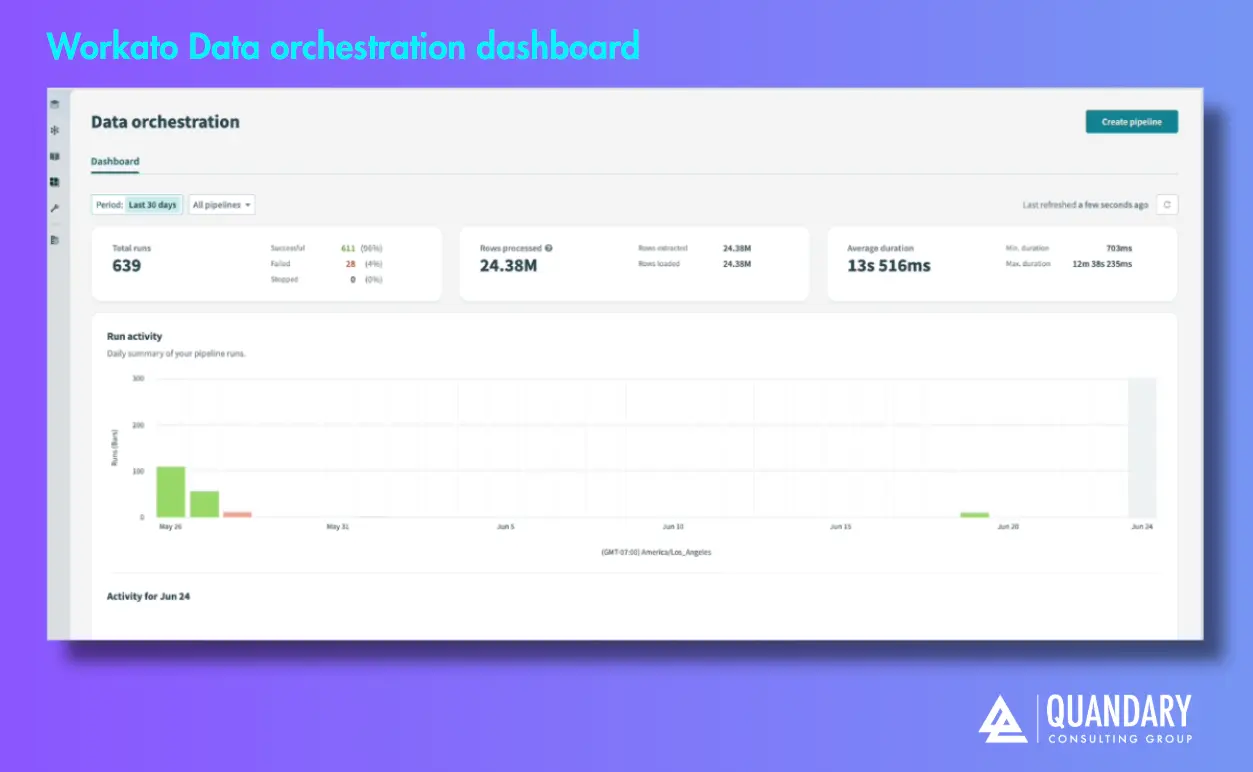
- This dashboard provides a 30-day summary of pipeline activity, including counts of successful, failed, and stopped runs.
- It also tracks daily row volumes and average run durations over time.
- You can use these metrics to locate unusual patterns and determine whether pipelines run consistently, fail frequently, or stop unexpectedly.
Run Activity Timeline
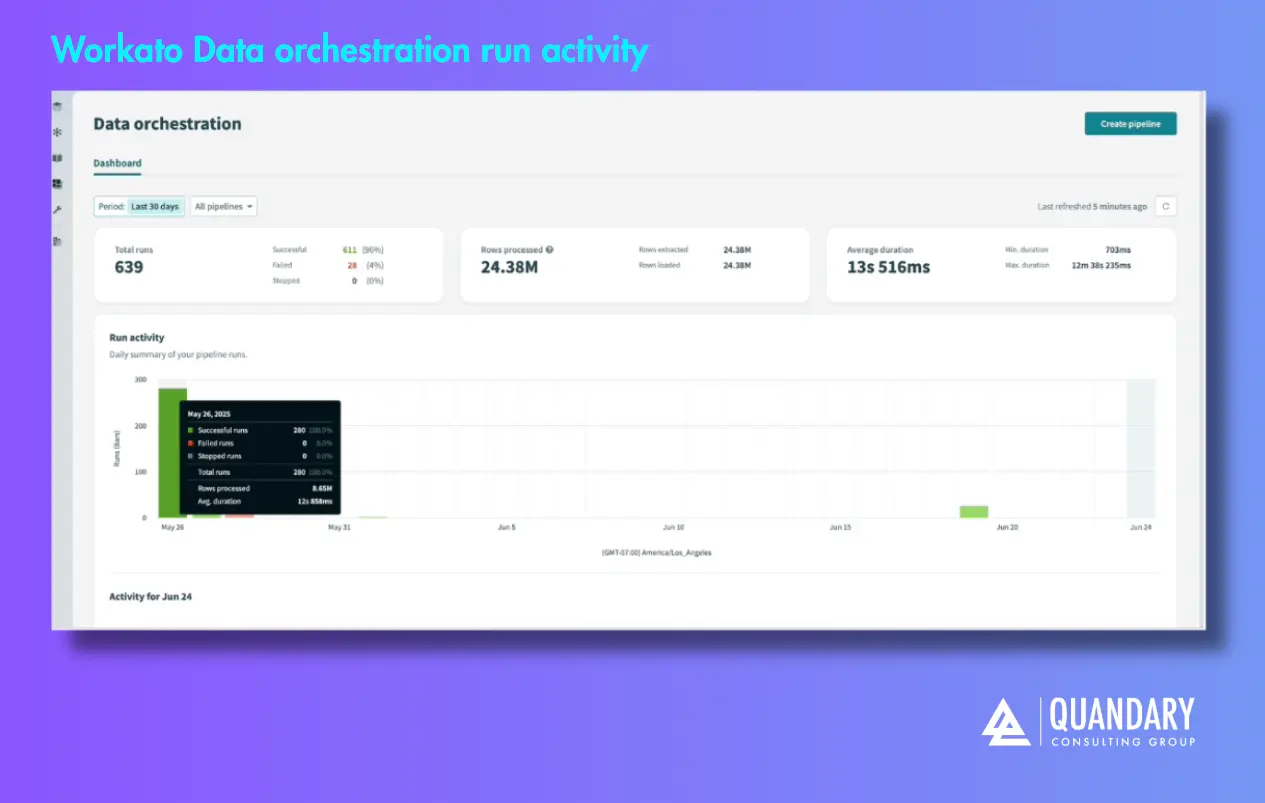
The Run Activity Timeline allows you to explore pipeline behavior over the past thirty (30) days.
- The chart (see chart below) shows the total runs per day, grouped by status.
- It also displays the average run duration and highlights changes in the volume of data processed.
Pipeline Activity Timeline
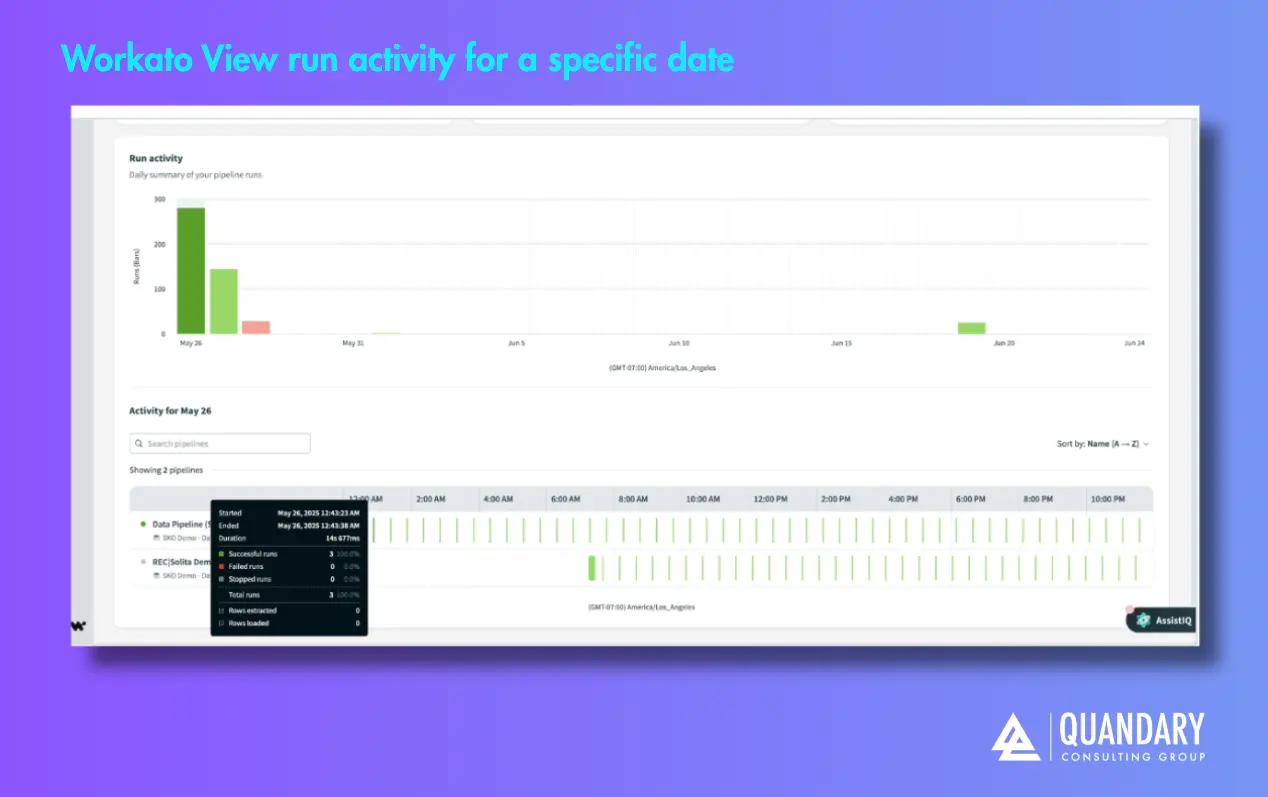
Select a day on the Run activity timeline (see chart below) to open the pipeline activity timeline for that date.
- You can use this view to compare runs across pipelines.
- The view spans 24 hours and includes a row for each pipeline.
- Each bar represents a sync activity that includes one or more runs.
- The bar's width reflects the total duration of the sync, and the color(s) indicates the outcome.
- You can hover over a bar to view run details such as timing, outcome distribution, total number of runs, and number of rows extracted and loaded.
Filter Dashboard Data
You can use filters to refine the dashboard view by time period or pipeline status, such as Active, Inactive, or Only failed runs.
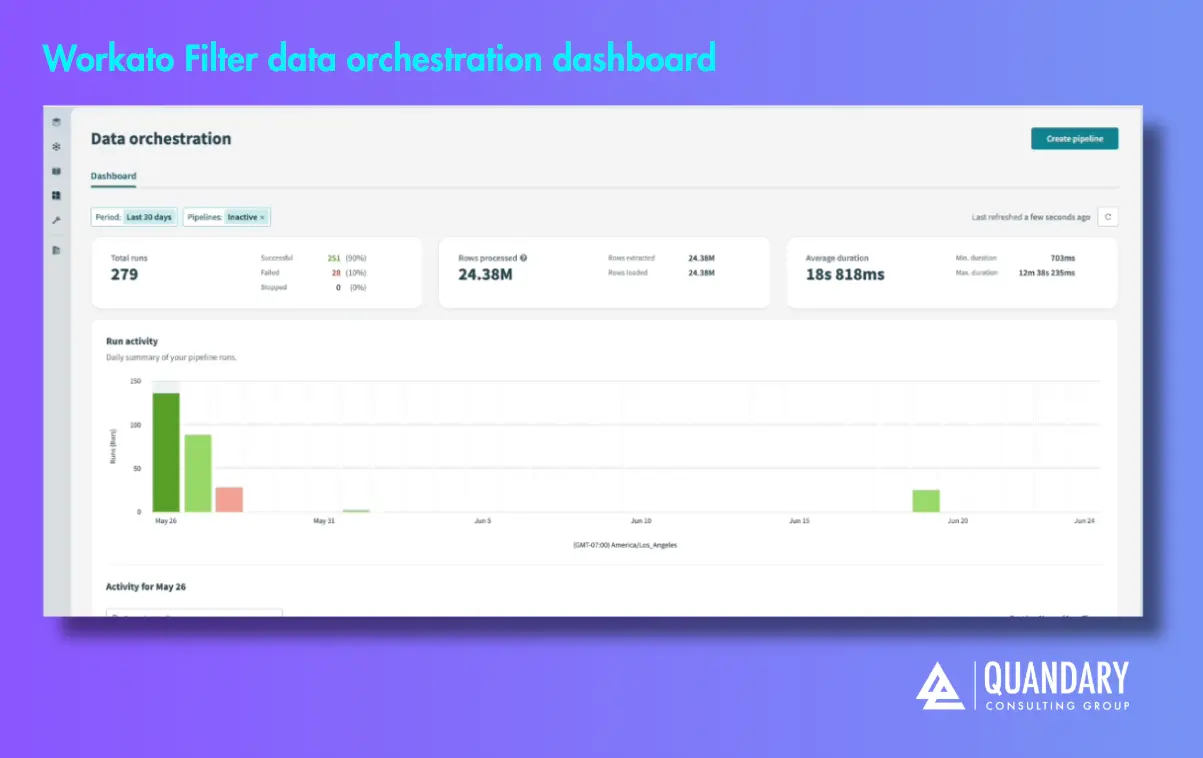
- By default, the dashboard displays all pipelines and statuses from the past thirty (30) days.
Troubleshoot Pipelines
Click any sync activity in the pipeline activity timeline to open the Object runs tab for that pipeline.
- This view lists all object-level runs for the selected period.
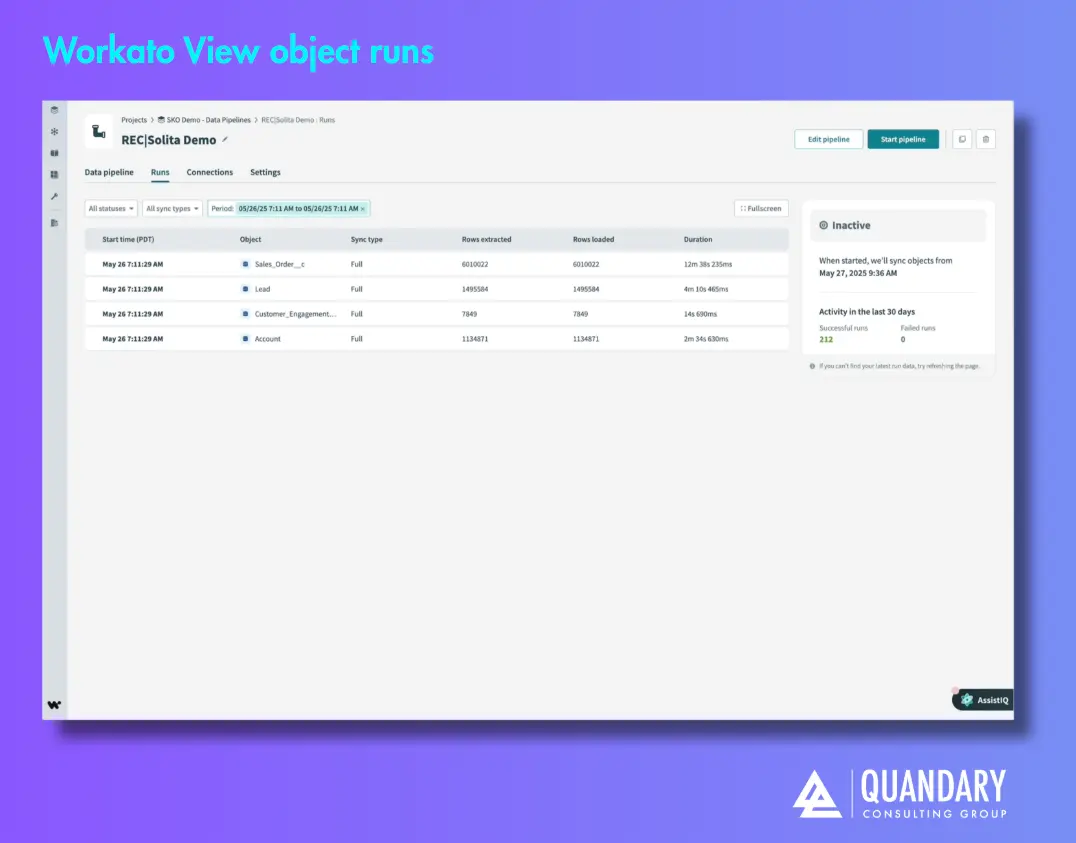
- You can use this tab to track object run status, review the execution history, analyze pipeline activity, and troubleshoot failures.
- Refer to the Troubleshoot your data pipeline section to learn how to locate and resolve failed runs.
What are the Key Strengths for Workato Data Orchestration
As a data orchestration platform, Workato has the following strengths.
LCNC (Low-Code/No-Code)
Workato is built on a low-code/no-code foundation, enabling users to create powerful data orchestration workflows with minimal coding. This approach provides flexibility without sacrificing simplicity, making it a versatile platform for users with varying technical backgrounds.
Workato's Flexible Structure
The flexibility of Workato's recipe-based structure allows you to design and execute data orchestration processes tailored to your specific needs. You can customize your workflows and connect with any system, automate complex workflows, or orchestrate data transformations, Workato's flexibility ensures a customizable solution.
Scalable
Workato offers bulk actions and triggers that give you the ability to scale and handle large volume data in Data Orchestration Workflows.
Reusable Components
Using reusable components such as Recipe functions in your data orchestration pipelines, enables you to build efficient and maintainable data orchestration workflows.
This approach reduces the overhead of managing numerous recipes and promotes a more streamlined and organized data orchestration process.
Observability
Observability is a key aspect of Workato's data orchestration solution.
Leveraging our logging service and job report, users can gain insights into the performance and status data orchestration pipelines.
This ensures transparency and facilitates proactive monitoring and issue resolution.
High Performance
Workato offers high performance through bulk operations and file storage capabilities.
These features contribute to the efficient execution of data orchestration tasks, ensuring optimal performance even with large datasets.
Bulk vs Batch
Bulk/Batch actions/triggers are available throughout Workato.
- Bulk Processing gives you the ability to process large amounts of data in a single job, especially suited for ETL/ELT.
- Batch Processing is restricted by batch sizes and memory constraints, and are generally less suitable in the context of ETL/ELT.
Extract, Transform, and Load (ETL)
ETL begins with the extraction phase, where data is sourced from multiple heterogeneous sources, including databases, files, APIs, and web services.
This raw data is then subjected to a transformation phase, such as cleaning or filtering before it is loaded into a target system, typically a data warehouse.
Extract, Load, and Transform (ELT)
Similar to ETL, ELT starts with the extraction phase, where data is extracted from various sources.
ELT focuses on loading the extracted data into a target system such as a data lake or distributed storage. Once the data is loaded, transformations occur within the target system.
- By: Logan Lott
- Email: llott@quandarycg.com
- Date published: 04/10/2026
FAQs - Workato Data Orchestration
How do I identify a Workato failed pipeline run?
Use the Data Orchestration dashboard to view run status, outcomes, and history. You can drill into specific runs via the activity timeline and object runs tab.
Where can I see detailed error logs for a pipeline in Workato?
Open the Runs/Object runs tab to view execution history, errors, and performance metrics for each object.
In Workato, what metrics should I monitor to detect issues early?
Key indicators include:
- Run success vs. failure rates
- Data volume changes
- Average run duration
These help identify anomalies or failing pipelines.
Why is my pipeline failing intermittently in Workato?
Common causes include:
- API rate limits or auth issues
- Data transformation errors
- Permission problems
- Large data loads causing timeouts
How do I troubleshoot Workato object-level failures?
Navigate to the Object runs tab, identify failed objects, and review their execution logs to isolate the issue.
What should I do if a pipeline stops unexpectedly?
We recommend checkin the following:
- Pipeline status (Active/Inactive/Stopped)
- Recent run history
- Any upstream connection or credential issues


Services
Industries

© 2026 Quandary Consulting Group 2026. All Rights Reserved.
Privacy Policy