
Knowledge Base
Articles In This Section
What Are Quickbase Dashboards How to Create a Dashboard in QuickbaseEmbedding an I-Frame (Webpage Widget) in a Dashboard | BEGINNERHow and When to Use Calculated Columns for Quickbase Reports How to Create Summary Report in Quickbase Utilizing the Dashboard Side Bar | BEGINNERHow to Build an Operations Dashboard in Quickbase | INTERMEDIATE to ADVANCEDHow to Color-Coding Rows for Quickbase Reports Using Automations to Log Approval Time and User in QuickbaseHow to Create External Stakeholder Forms, Reports, and Dashboards in QuickbaseUpdating the Default Table Home Page and Default Report Columns | BEGINNEROrganizing & Assigning Groups To Reports | BEGINNERLinking Dashboards Together | BEGINNERSetting Up Report and Chart Types in Quickbase | BASICSUsing Rich Text to make your Dashboard Pop | BEGINNERUsing Report Formulas as a Filter in a Report in QuickbaseKanban Reports | BEGINNERHow to Create an Audit or Change Logs with Automations Understanding and Setting Up Subscription Emails in Quickbase Create Audit/Change Logs with Automations | INTERMEDIATEHow to Set Up Pie Reports in Quickbase How to Build Standard Reports in Quickbase | BEGINNERAdding Reports to Dashboards | BEGINNERSections
Set Up Personalized Dashboards Using User-Filtered Reports
Quickbase Dashboard
Dashboards allow users to view data from multiple reports and multiple tables at the same time. For the most part, they are flexible and can be manipulated. This allows users can see the exact reports and data they want.
The greatest constraint of Dashboards is they are customizable by role, but not by the user. For apps with few users, this is not an issue because each user can be given a unique role and a unique dashboard. But as the number of users increases, it becomes unreasonable to continue to create unique dashboards for each user.
Problem
For apps with many users and lots of data, many dashboards have reports that contain too much data to be pertinent to an individual user. For example, on a project manager dashboard a summary report that summarizes all projects by status would be an ideal report to include. But for an individual project manager, the report would contain a lot of extra information because it would include every project manager’s projects.
Solution
Users in the same role need access to the same type of data (the same reports), but they do not want to have to sift through the data related to other users. It is not feasible to create unique reports and unique dashboards for each user within a role. The solution is to create reports that filter records to only show data related to the current user. For project managers, the solution would be to add a filter to each report on the dashboard to show records where the field Project Manager (or the name of the user-field that determines the user responsible for the record) is equal to the Current User.
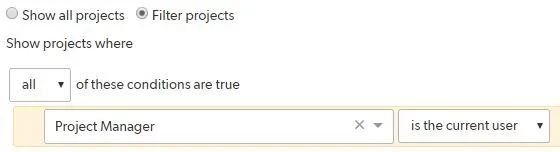
That way any project manager using the dashboard will only see their projects. They will no longer have to sift through projects they are not managing.
For more information on limiting which records users can view, modify and delete, check out: Conditional Filters for Record Permissions Using Roles.
If you want to learn more about Quickbase reporting, check out: Report and Chart Types.
- Author: TJ Lawless
- Email: tlawless@quandarycg.com
- Date Submitted: 4/15/2018

Resources


© 2026 Quandary Consulting Group. All Rights Reserved.
Privacy Policy