
Knowledge Base
Articles In This Section
What Are Quickbase Dashboards Set Up Personalized Dashboards Using User-Filtered ReportsHow to Create a Dashboard in QuickbaseEmbedding an I-Frame (Webpage Widget) in a Dashboard | BEGINNERHow and When to Use Calculated Columns for Quickbase Reports How to Create Summary Report in Quickbase Utilizing the Dashboard Side Bar | BEGINNERHow to Build an Operations Dashboard in Quickbase | INTERMEDIATE to ADVANCEDHow to Color-Coding Rows for Quickbase Reports Using Automations to Log Approval Time and User in QuickbaseHow to Create External Stakeholder Forms, Reports, and Dashboards in QuickbaseUpdating the Default Table Home Page and Default Report Columns | BEGINNEROrganizing & Assigning Groups To Reports | BEGINNERLinking Dashboards Together | BEGINNERSetting Up Report and Chart Types in Quickbase | BASICSUsing Rich Text to make your Dashboard Pop | BEGINNERUsing Report Formulas as a Filter in a Report in QuickbaseHow to Create an Audit or Change Logs with Automations Understanding and Setting Up Subscription Emails in Quickbase Create Audit/Change Logs with Automations | INTERMEDIATEHow to Set Up Pie Reports in Quickbase How to Build Standard Reports in Quickbase | BEGINNERAdding Reports to Dashboards | BEGINNERSections
Kanban Reports | BEGINNER
Why Kanban?
When it comes to managing large teams or work across multiple stages and resources, standard reports can be cumbersome. Interpreting large amounts of data and updating progress can be inefficient which often times can lead to confusion or delays.
That is where Kanban Reports, with drag-and-drop card views, come into play. The ability to instantly view, share, and update tasks makes it easier than ever to keep your teams focused and productive. You can display work items as cards organized in columns, and instantly update progress by dragging cards. Calculated fields, color codes and filtering dynamically update in real time as well.
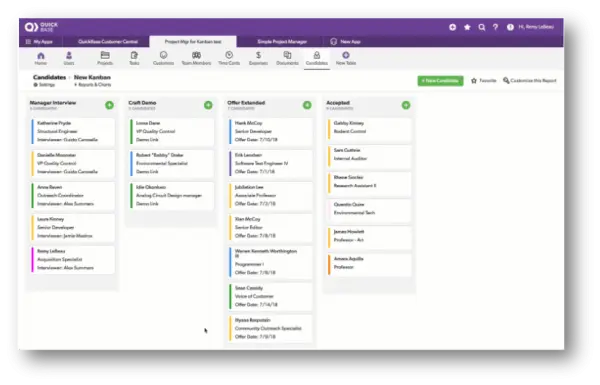
Benefits of Kanban Reports in Quickbase:
✓ Visibility into Real-Time Status Information.
✓ Data Collection for Process Improvement.
✓ Kick off an automated workflow by dragging a card.
✓ Drill-down on the card to view all the related information you need.
Create a Kanban Report:
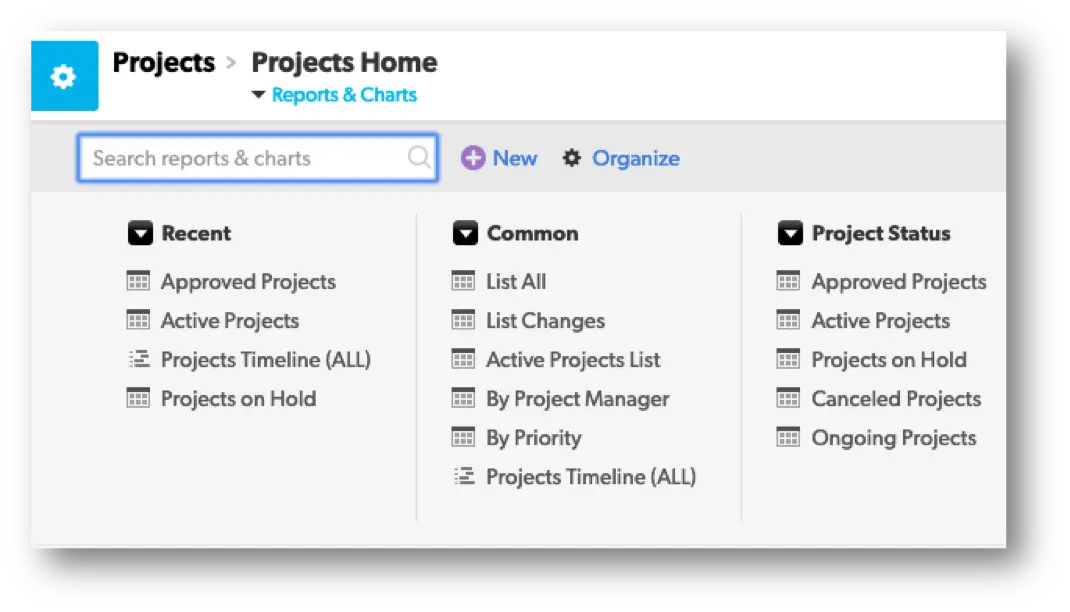
- From the Table bar, choose a table you would like the Kanban report to live in.
- Select Reports & Charts to open the reports and charts panel, then click +New
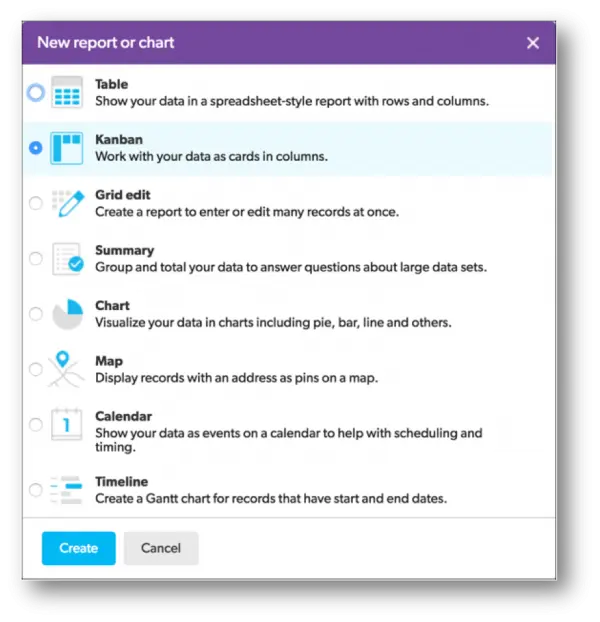
- Select Kanban from the list and click Create.
- Add a name and description.

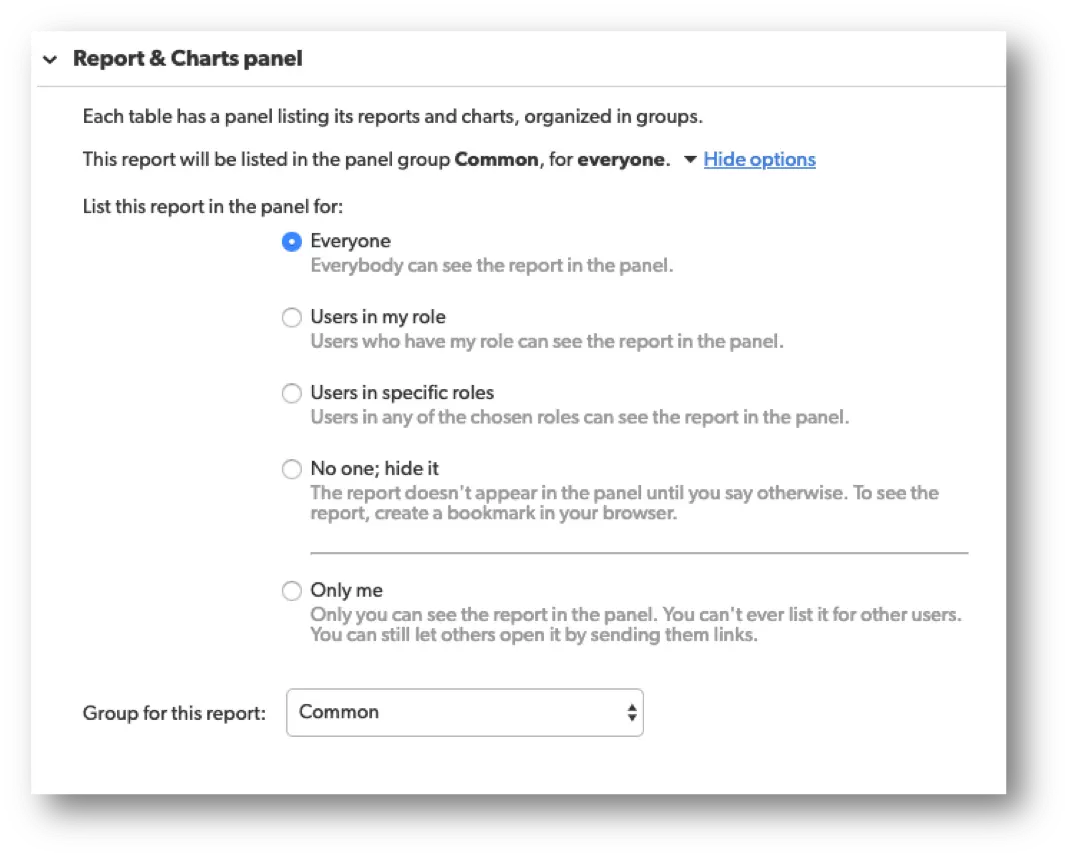
- In the Reports & Charts panel section, determine who can see this report.
When you save this type of report, you will have several choices to choose from. Each option will have a brief description next to them to help you select the best option.
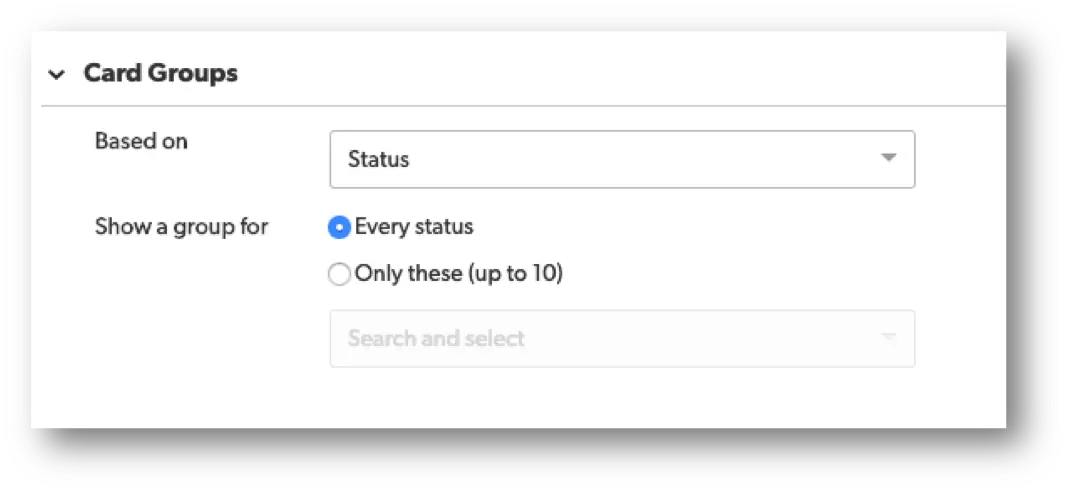
- In the Card Groups section, select the multiple-choice field or user field you want to use to group your cards into columns.EDITORS
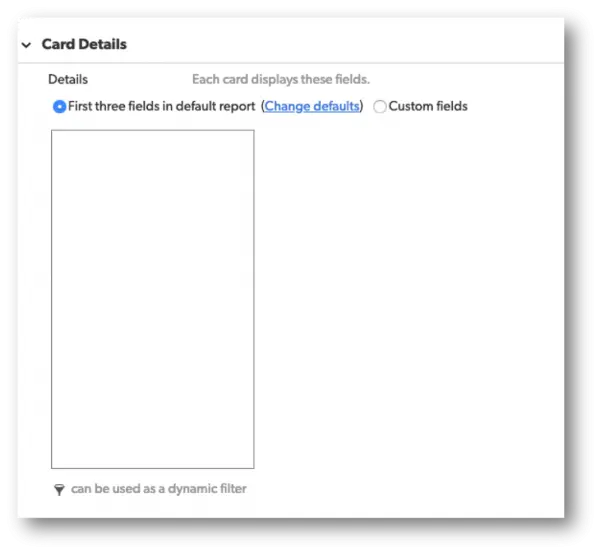
- In the Card Details section, you can customize the three fields you want to display on your cards. Otherwise, the cards will display the first three fields from the default settings.
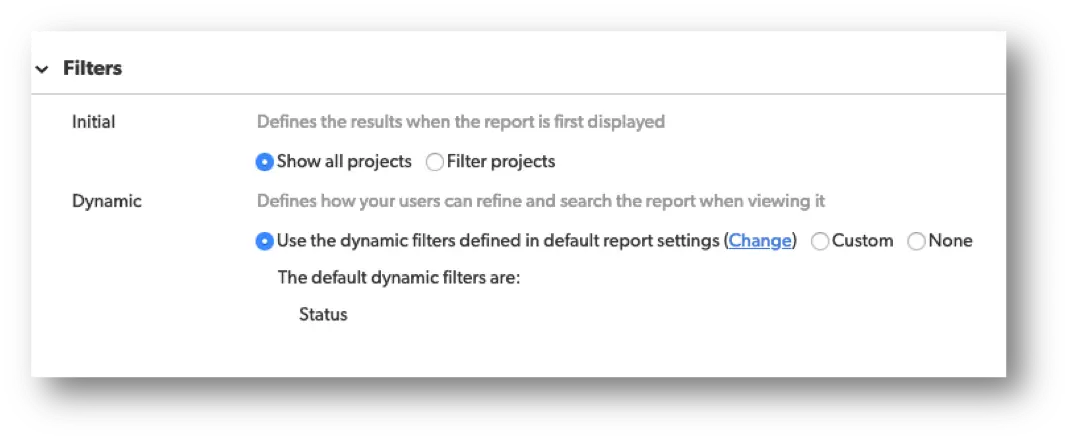
- In the Filters section, you can customize the data that displays. You have the option to set initial filters to only include pertinent information and also define dynamic filters that enable users to change the display to quickly view information that is relevant to them.
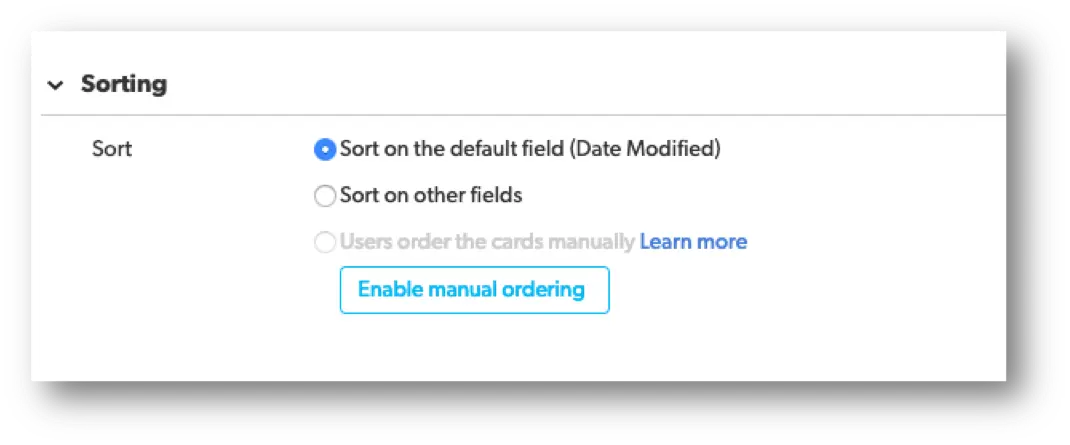
- In the Sorting section, select the fields to determine the order you want the kanban cards to appear within your columns.
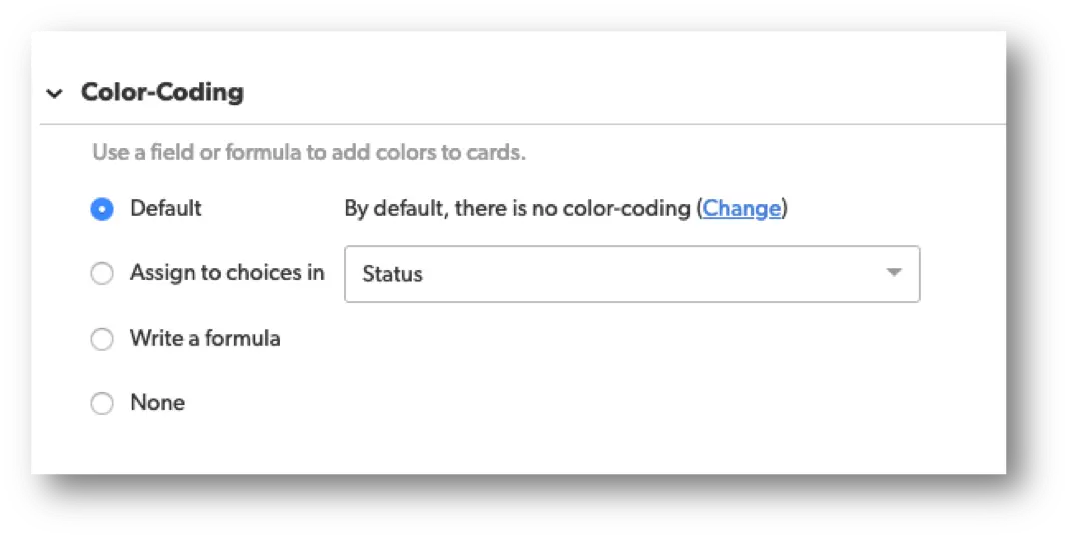
- To color-code your cards, select Color-code cards using a formula. To learn how, see: Color-Coding Rows in Reports | BEGINNER
To learn more about another type of report, check out more articles here: Reporting & Dashboards.
- Author: Alex Skudrovskis
- Email: askudrovskis@quandarycg.com)
- Date Submitted: 3/4/2019

Resources


© 2026 Quandary Consulting Group. All Rights Reserved.
Privacy Policy