
Knowledge Base
Articles In This Section
What Are Quickbase Dashboards Set Up Personalized Dashboards Using User-Filtered ReportsHow to Create a Dashboard in QuickbaseHow and When to Use Calculated Columns for Quickbase Reports How to Create Summary Report in Quickbase Utilizing the Dashboard Side Bar | BEGINNERHow to Build an Operations Dashboard in Quickbase | INTERMEDIATE to ADVANCEDHow to Color-Coding Rows for Quickbase Reports Using Automations to Log Approval Time and User in QuickbaseHow to Create External Stakeholder Forms, Reports, and Dashboards in QuickbaseUpdating the Default Table Home Page and Default Report Columns | BEGINNEROrganizing & Assigning Groups To Reports | BEGINNERLinking Dashboards Together | BEGINNERHow to Create Reports and Charts in QuickbaseUsing Rich Text to make your Dashboard Pop | BEGINNERUsing Report Formulas as a Filter in a Report in QuickbaseHow to Create a Kanban Report in QuickbaseHow to Use Report Formulas as a Filter in a Quickbase ReportHow to Create an Audit or Change Logs with Automations Understanding and Setting Up Subscription Emails in Quickbase Create Audit/Change Logs with Automations | INTERMEDIATEHow to Create a Pie Chart in QuickbaseHow to Build Standard Reports in Quickbase | BEGINNERAdding Reports to Dashboards | BEGINNERSections
How to add a Webpage Widget (embedded iFrame) to your Quickbase Dashboard?
A web Page widget in Quickbase is a feature that lets you embed an external webpage directly inside a Quickbase dashboard.
Think of it like a window on your dashboard that displays content from another website or web app.
What is a Web Page Widget?
Web Page Widgets allows you to embed HTTPS web pages (HTTP web pages are not supported) inside your app Home page.
This allows your app Home page to show web-based applications and services, such as incident trackers and mail clients, as well as useful information such as area maps or stock market reports.
Not all external web pages behave properly when embedded in a Web Page widget.
For example, www.google.com does not allow embedding in an iframe.
What does a Web Page Widget in Quickbase Do
- Shows live external content: reports, maps, charts, or other tools
- Integrate third-party apps without leaving Quickbase
- Keep everything your team needs in one place as a single source of truth
Common Web Page Widget examples
People use web page widgets to embed things like:
- Google Maps locations
- Power BI dashboards
- Tableau dashboards
- Internal tools or portals
- Documentation pages
- Forms from other systems
How does a Web Page Widget Work
You paste a URL (link) into the widget, and Quickbase loads that page inside your dashboard.
Limitations of Web Page Widgets in Quickbase
- The external site must allow embedding (some block this for security)
- You may need to log in separately if the page requires authentication
- Not all interactive features always work perfectly inside the frame
What is an embedded iFrame?
Embedding an iFrame in a Quickbase Dashboard allows you to view and navigate the contents of an outside webpage within your Quickbase Application.
An iFrame is an HTML document embedded inside another website. Think of the iFrame as a window into another webpage.
Why Embedded an iFrame into your Quickbase Dashboard?
- Show new leads from SurveyMonkey within an outreach app to track performance
- Show reports from weather.com for technicians to view conditions before deploying to a site
- Show a Quickbase report on a dashboard that has already embedded the maximum number of reports allowed by Quickbase
Types of Web Pages that do NOT Work Well as a Widget in Quickbase
- Pages that use HTTP protocol, particularly in the Firefox and Google Chrome browsers.
- Pages that "break frames" will redirect to the embedded site so that you can no longer see the app Home page.
- Pages that do not allow embedding in an iframe. If you attempt to embed a page that blocks embedding, the page will never load, and your browser will show an empty box in place of the embedded page.
- YouTube videos sometimes remain visible when a Report or Chart widget is expanded to full screen.
How to add a Web Page Widget (embedded iFrame) to your Quickbase Dashboard?
Step 1: Visit the dashboard to which you would like to add your iFrame and click ‘Edit’
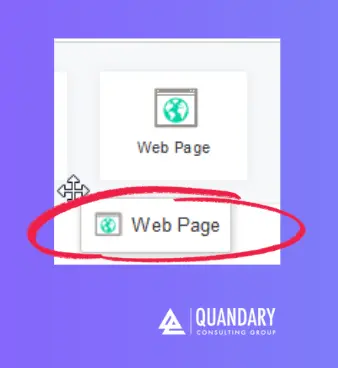
Step 2: You will see the following options which you may add to your dashboard:
- Click and hold on the option titled ‘Web Page’ and pull the icon onto to the body of your dashboard
Step 3: You will now see a large grey area on your dashboard representing an unassigned ‘Web Page’ widget.
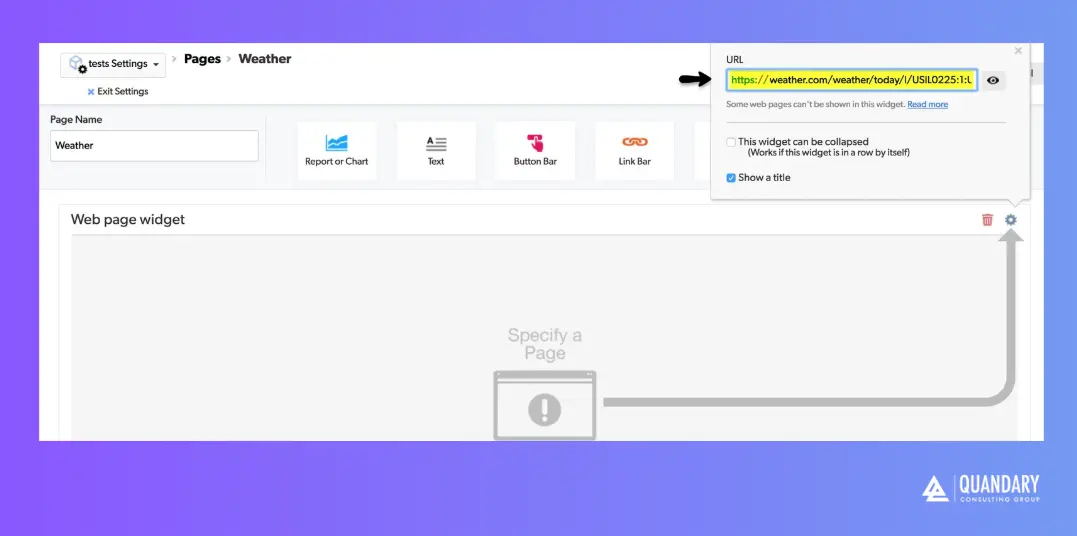
- In picture above you can see a highlighted text box. This is where you can enter the URL of the webpage you would like to display.
- In this case, I have chosen to add the weather.com URL for weather in Chicago, IL: https://weather.com/weather/today/l/USIL0225:1:US
- Click away from the URL box and your webpage will appear in place of the grey area.
Step 4: Often times, including this example, the widget area is too short to display the website as intended:
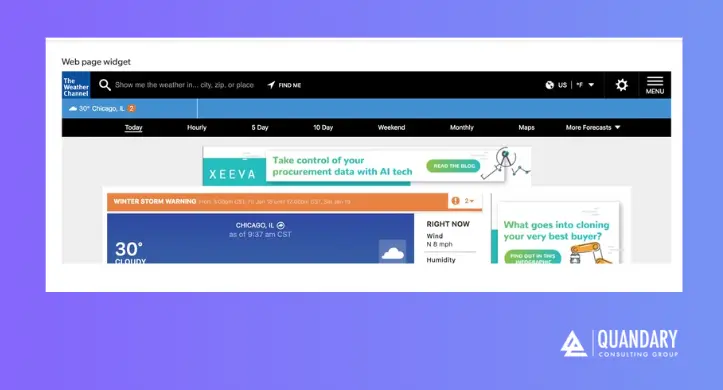
- To increase the widget height simply edit your dashboard and hover over the bottom of the widget area.
- Once you see an arrow, drag downward to increase the height of the widget.
How to Add a Report to a Quickbase Dashboard as a Web Page Widget
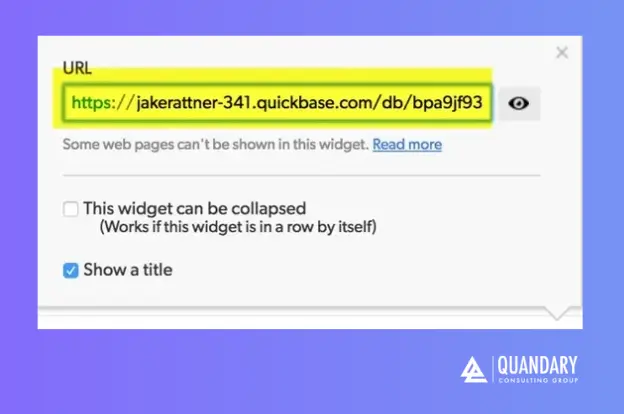
Step 1: Start by locating your report and copying the report URL
Step 2: Add a new web Page widget and paste the URL you just copied into the URL pop-up:
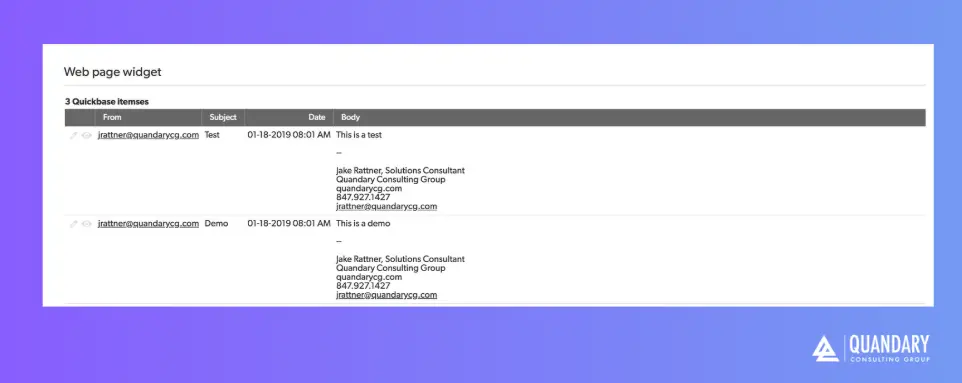
Step 3: After entering your URL, click away from the URL box and view the resulting report
- You’ll notice right away that this report doesn’t look like your other embedded reports
- Rather than showing just the contents of the report, you’re viewing the report within the full Quickbase website:
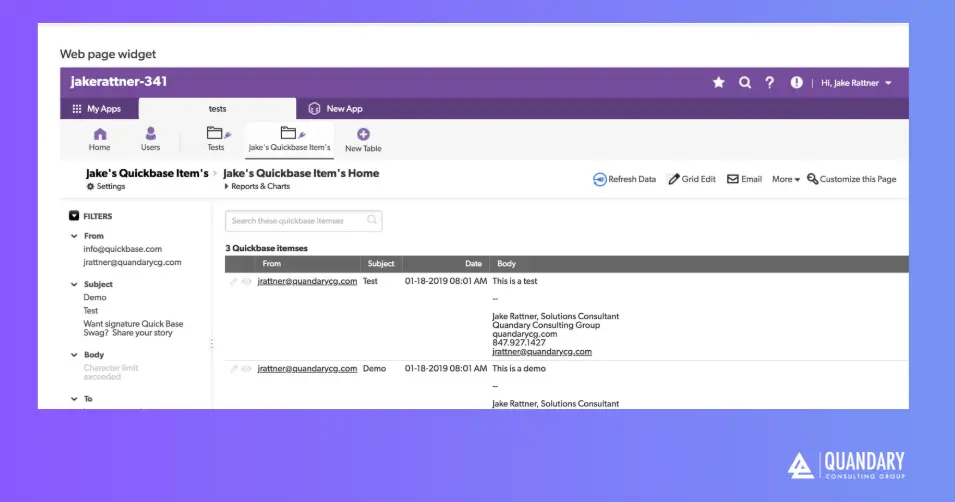
- Notice how I can see more than just the report - I am viewing the report as if I was navigating within my browser.
- In order to get this report to look similar to your other dashboard reports you will need to take two additional steps
Step 4: In order to show only the report, add the following text to the end of the URL: &ifv=1
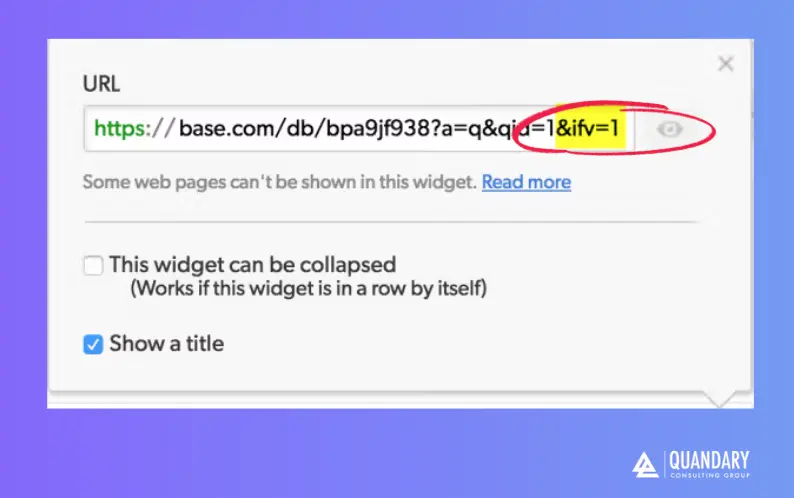
- Now view your report. You will now notice that only the report is visible and looks much better.
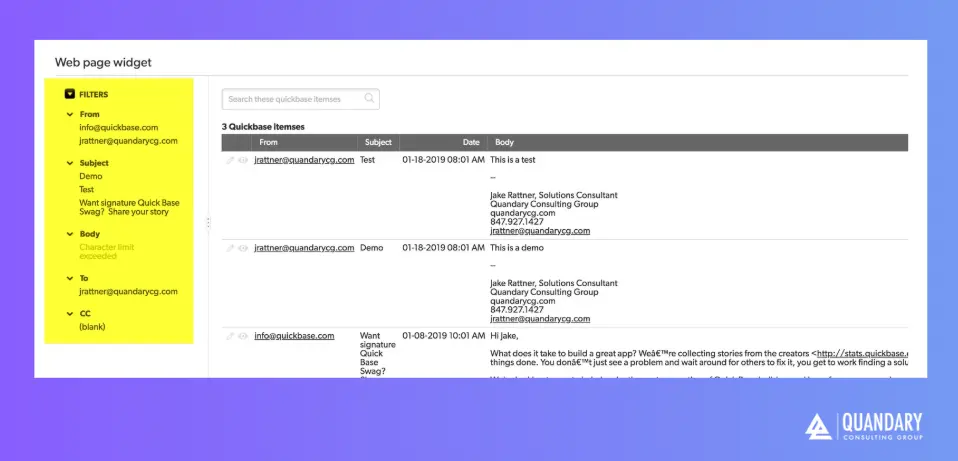
- However if you look at the pic below you will notice we still have our filters on the left of the report:
Step 5: To remove the filters, simply go to the original report.
- Click “Customize this report’ and remove the filters from the report by selecting ‘None’ for Dynamic Filters:
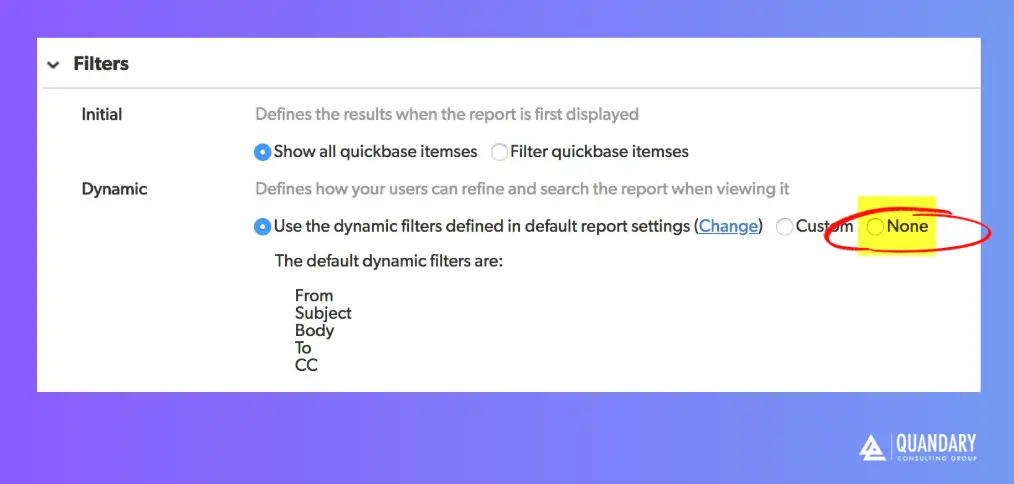
- Now your Webpage Widget will look almost identical to a report added via the Report Widget:
These are just two examples of powerful dashboard features within Quickbase.
For more Quickbase How-To articles, visit our Quickbase Knowledge Base center
FAQs - Embedding an iFrame (Web Page Widget) in Quickbase
1. How do I embed an iFrame in Quickbase?
To embed an iframe in Quickbase, you typically use a Rich Text Formula field or a code page.
- Add your iframe HTML (e.g.,
<iframe src="URL"></iframe>) inside the field or page, then display it on a form or dashboard. - Make sure the source URL allows embedding (no
X-Frame-Optionsrestrictions).
2. Why is my iFrame not displaying in Quickbase?
If your iframe is not showing, the most common causes are:
- The external site blocks embedding via X-Frame-Options or Content Security Policy (CSP)
- The URL is not HTTPS (Quickbase requires secure content)
- Browser security restrictions
Check the source site’s headers and ensure it allows embedding.
3. Can I embed external apps or dashboards in Quickbase using an embedded iFrame?
Yes, you can embed many external tools—such as Power BI, Tableau, Google Maps, or custom web apps—using an iframe, as long as the provider supports embedding.
- Some services require authentication tokens or embed codes for secure access.
4. Is embedding an iFrame in Quickbase secure?
Embedding an iframe is generally safe if:
- The source is trusted and secure (HTTPS)
- You avoid exposing sensitive data in URLs
- You follow your organization’s security and compliance policies
Quickbase itself does not control the iframe content, so security depends on the external source.
5. What are the limitations of using iFrames in Quickbase?
Common limitations include:
- Some websites block iframe embedding entirely
- Limited control over styling and responsiveness
- Potential performance issues with heavy external content
- Authentication challenges for private apps
For advanced use cases, consider Quickbase Pipelines, APIs, or custom integrations instead of iFrames.
- Author: Alistair Marsden
- Email: amarsden@quandarycg.com
- Date Updated: 06/03/2025

Industries
Resources


© 2026 Quandary Consulting Group. All Rights Reserved.
Privacy Policy