
Knowledge Base
Articles In This Section
What Are Quickbase Dashboards How to Set Up Personalized Dashboards in QuickbaseHow to Create a Dashboard in QuickbaseHow to add a Webpage Widget (embedded iFrame) to your Quickbase DashboardHow and When to Use Calculated Columns for Quickbase Reports How to Create a Summary Report in QuickbaseHow to Utilize the Dashboard Side Bar in QuickbaseHow to Build an Operations Dashboard in Quickbase How to Color-Coding Rows for Quickbase Reports Using Automations to Log Approval Time and User in QuickbaseHow to Create External Stakeholder Forms, Reports, and Dashboards in QuickbaseHow to Organize & Assign Groups to Quickbase ReportsHow to Link Dashboards Together in QuickbaseHow to Create Reports and Charts in QuickbaseHow to use Rich Text to Make your Quickbase Dashboard Dynamic Using Report Formulas as a Filter in a Report in QuickbaseHow to Create a Kanban Report in QuickbaseHow to Organize and Assign Groups to Quickbase ReportsHow to Use Report Formulas as a Filter in a Quickbase ReportUnderstanding and Setting Up Subscription Emails in Quickbase How to Create an Audit or Change Logs with Automations How to Create a Pie Chart in QuickbaseHow to Build Standard Reports in QuickbaseHow to Add a Report to your Quickbase DashboardSections
How to Update the Default Table and Report Columns in Quickbase
In a Quickbase application, when a user navigates to a table, they are taken to the table home page. Initially, Quickbase displays the ‘Default report’; it is automatically created for each table in a Quick Base application. Initially, it is a ‘list all’ report that displays the default report columns and dynamic filters.
The default columns, dynamic filters, and report can be adjusted to suit the needs of the users by following the directions below.
How to Customize your Quickbase Navigation?
To customize the default table home page, report columns, and dynamic filters:
- Navigate to the Quickbase Home Page
- Click ‘Customize this Page’
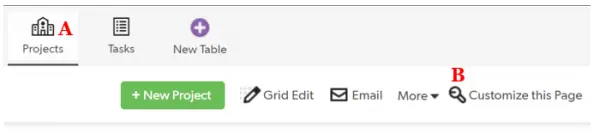
How to Change the Default Table on your Quickbase Homepage?
Originally, the default report will show for all users. However, the report that displays on the table home page can be changed.
- It can be the same report for all users or a different report for each role.
- If you want the report on the table home page to be the same for every user, irregardless of role, then select, the ‘The same view for everyone’ radio button
- If you want the report on the table home page to be different based on the user’s role, then select, the ‘A view based on the user’s role radio button (D).
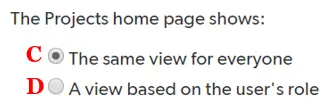
To change the report that displays on the table home page, click the dropdown in the ‘View’ column and select the desired report (E).

How to Change the Default Report Columns on your Quickbase Homepage?

The default report columns and dynamic filters can be edited by clicking on the hyperlink, ‘Default report settings’ (F above).
- Or following the path: table -> settings -> reports and charts -> reporting defaults -> default report settings.
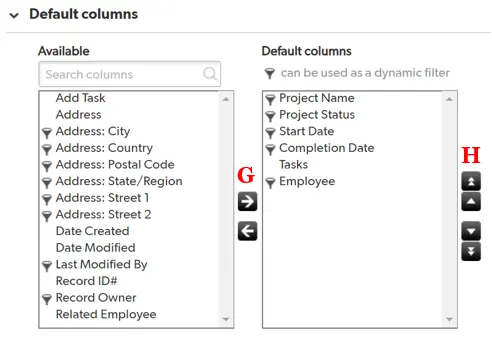
The first section of the settings page is ‘Default Columns’ (see image below for reference)
- Columns can be added by selecting the field you want to add from the ‘Available’ box
- They can be subtracted by selecting the field you want to remove from the ‘Default columns’ box by clicking the arrows (G).
- The arrows (H) to the right of the boxes change the order of the default columns.
The radio buttons below the column boxes allow you to choose how new fields added to a table will be treated (I).
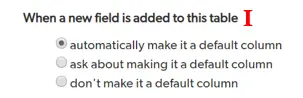
- When fields are added and ‘automatically make it a default column’ is checked, then the new fields will become default columns,
If ‘ask about making it a default column’ is checked, then the user will have the option to make or not make the new fields default columns,
- If ‘don’t make it a default column’ is checked, then the new fields will not become default columns.
The default dynamic filters can be customized or not shown on the default report (J).
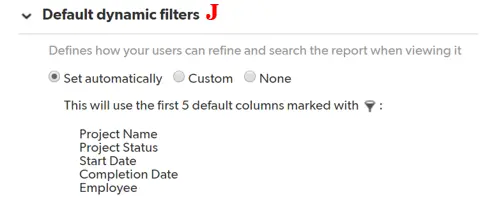
- If ‘Set automatically’ is checked, then the first five, filterable, fields will become the default dynamic filters,
- If ‘Custom’ is selected, then the user can choose the dynamic filters (similar to choosing default columns G and H),
- If ‘None’ is selected, then the report will have no dynamic filters.
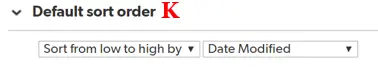
Finally, the order of the records can be customized by changing the field in the ‘Default sort order’ section (K).
- Author: Alistair Marsden
- Title: Solution Consultant | Quickbase
- Email: amarsden@quandarycg.com
- Date Updated: April 28, 2026
Top FAQs about Updating the Default Table Home Page and Default Report Columns in Quickbase
1. How do I change the default table home page in Quickbase?
To change the default table home page in Quickbase:
- Open the desired table.
- Click Customize this Page.
- Choose either:
- The same view for everyone
- A view based on the user’s role
- Select the report you want displayed from the View dropdown.
This allows administrators to control which report users see first when accessing a table.
2. How do I change the default report columns in Quickbase?
To update default report columns in Quickbase:
- Navigate to:
Table → Settings → Reports & Charts → Reporting Defaults → Default Report Settings - In the Default Columns section:
- Add fields from the Available list
- Remove fields from the Default Columns list
- Reorder fields using the arrow controls or drag-and-drop.
- Save your changes.
These columns become the default layout for new reports and table views.
3. What are dynamic filters in Quickbase?
Dynamic filters in Quickbase allow users to filter report data without editing the report itself.
Dynamic filters:
- Improve report usability
- Help users quickly find records
- Can be customized by administrators
Quickbase supports up to five dynamic filters per report.
4. How do I customize dynamic filters in Quickbase?
To customize dynamic filters:
- Open Default Report Settings.
- Locate the Dynamic Filters section.
- Choose one of the following options:
- Set Automatically
- Custom
- None
- Set Automatically
- If using Custom, select the fields you want available as filters.
Custom dynamic filters improve reporting efficiency and user experience.
5. Can Quickbase show different default reports for different user roles?
Yes. Quickbase supports role-based table home pages. Administrators can assign different reports to different roles by:
- Clicking
- Selecting
- Assigning reports by role
This helps tailor the application experience for different departments or teams.
6. Why does my Quickbase table home page show a search form instead of a report?
When a Quickbase table exceeds approximately 10,000 records, Quickbase may automatically replace the default report with a search form.
This behavior improves:
- Application performance
- Page load times
- Large dataset usability
This is a built-in Quickbase optimization feature.
7. How do I change the default sort order in Quickbase reports?
To change the default sort order:
- Navigate to
- Find the Default Sort Order section
Select:
- The field to sort by
- Ascending or descending order
Save the settings
The selected sort order becomes the default for new reports and views.
8. What happens when new fields are added to a Quickbase table?
Quickbase allows administrators to decide how new fields are handled in reports.
Options include:
- Automatically add new fields as default columns
- Ask whether to include new fields
- Never add new fields automatically
These settings help maintain report consistency and usability.
9. Where are Quickbase reporting default settings located?
Quickbase reporting defaults can be found at:
Table → Settings → Reports & Charts → Reporting Defaults → Default Report Settings
From this area, administrators can configure:
- Default columns
- Dynamic filters
- Sort order
- New field behavior
These settings define the default reporting experience for users.
10. Why should I customize default reports and table home pages in Quickbase?
Customizing Quickbase default reports improves:
- User experience
- Reporting efficiency
- Data visibility
- Team productivity
- Application performance
Well-designed default reports help users access the most important data immediately without needing to build custom reports manually.
Organizations often customize reports by:
- Department
- Role
- Workflow
- Business process
This creates a more intuitive and scalable Quickbase application.


Industries
Resources


© 2026 Quandary Consulting Group. All Rights Reserved.
Privacy Policy