
Knowledge Base
Articles In This Section
What Are Quickbase Dashboards How to Set Up Personalized Dashboards in QuickbaseHow to Create a Dashboard in QuickbaseHow to add a Webpage Widget (embedded iFrame) to your Quickbase DashboardHow and When to Use Calculated Columns for Quickbase Reports How to Create a Summary Report in QuickbaseHow to Utilize the Dashboard Side Bar in QuickbaseHow to Build an Operations Dashboard in Quickbase How to Color-Coding Rows for Quickbase Reports Using Automations to Log Approval Time and User in QuickbaseHow to Create External Stakeholder Forms, Reports, and Dashboards in QuickbaseHow to Update the Default Table and Report Columns in QuickbaseHow to Organize & Assign Groups to Quickbase ReportsHow to Link Dashboards Together in QuickbaseHow to Create Reports and Charts in QuickbaseHow to use Rich Text to Make your Quickbase Dashboard Dynamic Using Report Formulas as a Filter in a Report in QuickbaseHow to Organize and Assign Groups to Quickbase ReportsHow to Use Report Formulas as a Filter in a Quickbase ReportUnderstanding and Setting Up Subscription Emails in Quickbase How to Create an Audit or Change Logs with Automations How to Create a Pie Chart in QuickbaseHow to Build Standard Reports in QuickbaseHow to Add a Report to your Quickbase DashboardSections
How to Create a Kanban Report in Quickbase
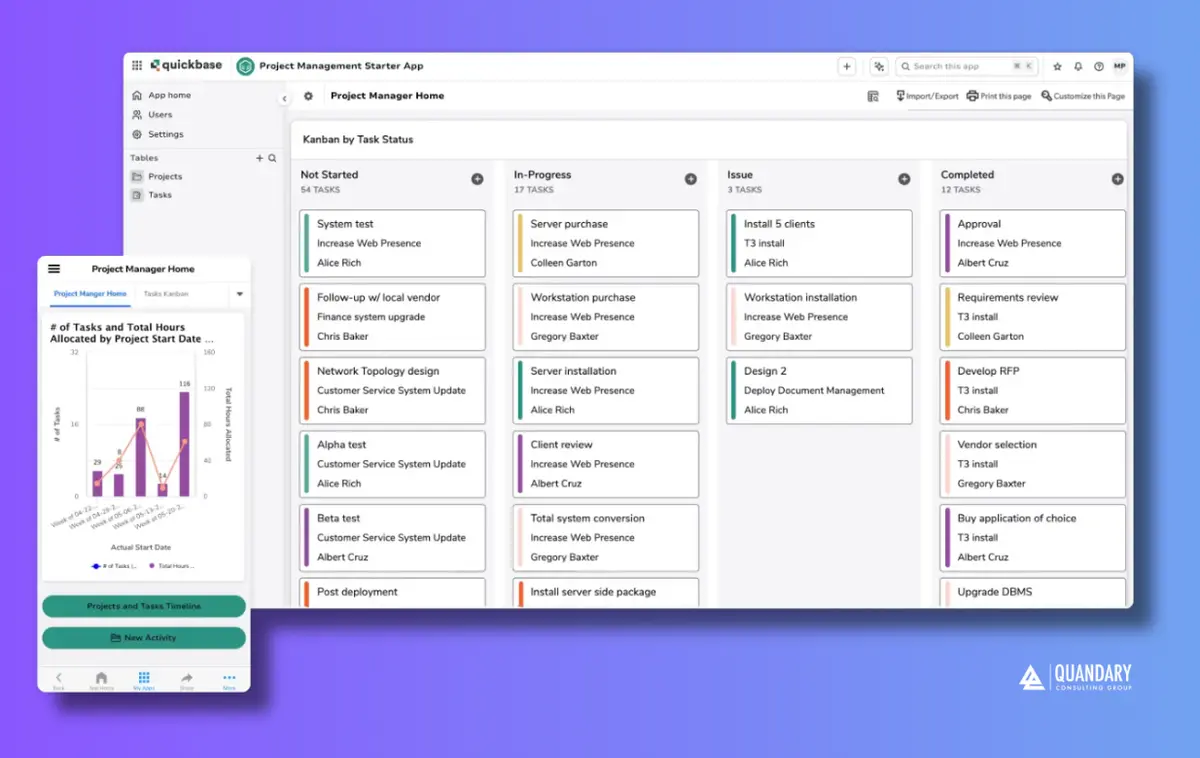
For anyone who tracks work that goes through stages or categories, Kanban reports in Quickbase let you visualize your data in cards that are easily moved between categories.
- For example, in a Sales Manager app your sales team can view their opportunities organized by funnel stage. Then they can drag an opportunity card from one stage to another as the opportunity progresses.
The columns in a Kanban report are based on values in a single-select multiple choice field or a user field.
- In our Sales Manager app example, the multiple choice field is called "Stage." Each time you drag an opportunity card to a new column, you change the value in that "Stage" field.
Key Components of a Kanban Report
Kanban Board Snapshot
Displays tasks across columns such as To Do, In Progress, and Done.
Work in Progress (WIP)
Shows how many tasks are actively being worked on at any given time.
Cycle Time
Measures how long it takes for a task to move from start to completion.
Lead Time
Tracks the total time from when a task is created to when it is completed.
Throughput
Indicates how many tasks are completed in a specific time period.
Bottleneck Analysis
Identifies stages where work is slowing down or piling up.
Types of Kanban Reports Available in Quickbase
Cumulative Flow Diagram (CFD)
Visualizes work across stages over time to spot bottlenecks.
Control Chart
Tracks cycle time variability and predictability.
Throughput Report
Shows completed work over time.
WIP Report
Monitors how much work is in progress at each stage.
How to Create a Kanban Report in Quickbase
Step 1: From the sidebar, choose a table that has a single-select multiple choice field or a user field
- Note: You will only be able to create a Kanban report if you have a single-select multiple choice field or a user field.
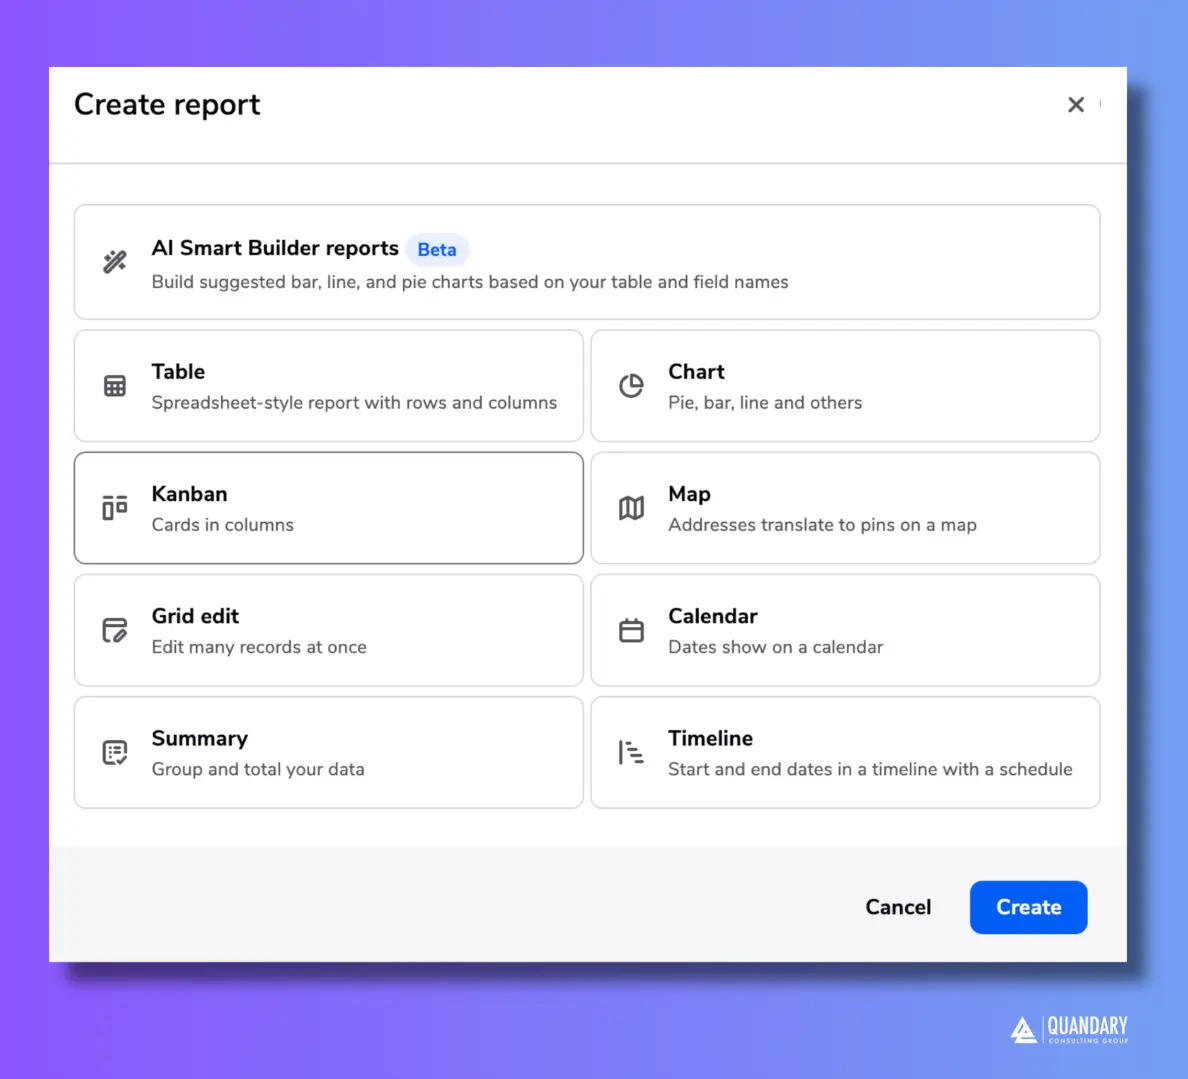
Step 2: Select Reports to open the reports and charts panel, then click +New Report.
Step 3: Select Kanban from the list and click Create.
Step 4: Add a name and description.
Step 5: In the Reports & Charts panel section, determine who can see this report listed in their panel.
- You can also choose to organize the report into an existing group in the panel.
Quick Note About Saving Reports
You can save reports for others to see in the Reports & Charts area for a table if the manager of the app has granted you permission to do so.
When you save this type of shared or common report, so that others can see it, you have several choices:
- Everyone. Everybody can see the report in the panel.
- Users in my role. Users who have my role can see the report in the panel.
- Users in specific roles. Users in any of the chosen roles can see the report in the panel.
- No one; hide it. The report doesn't appear in the panel until you say otherwise. To see the report, create a bookmark in your browser.
If your report is personal, choose Only me. Only you can see the report in the panel. You can't ever list it for other users. You can still let others open it by sending them links
Step 6: In the Card Groups section, select the multiple-choice field or user field you want to use to group your cards into columns.
- For example, in your Sales Manager app, you can select the field called "Stage" to see your team's opportunities categorized by where they are in the sales funnel.
- You can choose to show up to 15 groups. So if you your sales funnel has 20 stages but not every stage is relevant for your users, you can select the 15 you want to appear in your report.
- Note: Each group will display the first 100 records as cards on your report.
Step 7: In the Card Details section, you can customize the three fields you want to display on your cards.
- Otherwise, the cards will display the first three fields from your default settings.
Step 8: In the Filters section, you can customize the data that displays.
- You can set initial filters to include only relevant data and also define dynamic filters that enable users to change the display to quickly get just the view of data that they need.
- For example, to customize which opportunities from your table appear in your Kanban report, add an initial filter.
- Click here to learn more about filter Records in Quickbase
Step 9: In the Sorting section, select the field to determine the order you want the cards to appear within your columns
- If your app admin has enabled manual ordering for this table, you can choose to let users determine the vertical ordering by dragging cards within columns.
- Click here to more about manual ordering in Kanban Reports in Quickbase
Step 10: To color-code your cards, select Color-code cards using a formula
How to Edit your Kanban Report with the Quickbase's Report Builder Panel
Beginning in 2022, Quickbase is introducing a report builder panel that will eventually cover all report types.
The report builder panel duplicates the behavior of the report builder page, and allows you to make edits while looking at your report. Kanban reports are the first type of report to have access to this report builder panel.
- To open, it, click Customize this report near the top of the Kanban report.
For more specific instructions on using the report builder panel, read our article on customizing your Kanban report with the report builder panel.
FAQs - Quickbase Kanban Reports
1. What is a Kanban report in Quickbase?
A Kanban report in Quickbase is a visual report type that displays records as cards organized into columns based on a selected field (such as status or stage).
It allows users to track workflows, manage tasks, and move records between stages using drag-and-drop functionality.
2. How do you create a Kanban report in Quickbase?
To create a Kanban report in Quickbase:
- Go to the table you want to report on
- Click Reports & Charts → New Report
- Select Kanban as the report type
- Choose a grouping field (e.g., status)
- Customize card fields and layout
- Save and share the report
3. What are the benefits of using Kanban reports in Quickbase?
Kanban reports in Quickbase help teams:
- Visualize workflows in real time
- Identify bottlenecks and delays
- Improve task prioritization
- Enable drag-and-drop updates
- Increase team collaboration and transparency
4. Can you customize Kanban reports in Quickbase?
Yes, Quickbase Kanban reports are highly customizable. Users can:
- Choose which fields appear on cards
- Define column groupings (status, owner, etc.)
- Apply filters to show specific records
- Adjust sorting and display settings
- Use conditional formatting for better visibility
- By: Jeff Richey
- Email: jrichey@quandarycg.com
- Date updated: 11/14/2025

Industries
Resources


© 2026 Quandary Consulting Group. All Rights Reserved.
Privacy Policy