
Knowledge Base
Articles In This Section
What Are Quickbase Dashboards How to Set Up Personalized Dashboards in QuickbaseHow to Create a Dashboard in QuickbaseHow to add a Webpage Widget (embedded iFrame) to your Quickbase DashboardHow and When to Use Calculated Columns for Quickbase Reports How to Create a Summary Report in QuickbaseHow to Utilize the Dashboard Side Bar in QuickbaseHow to Build an Operations Dashboard in Quickbase How to Color-Coding Rows for Quickbase Reports Using Automations to Log Approval Time and User in QuickbaseHow to Create External Stakeholder Forms, Reports, and Dashboards in QuickbaseHow to Update the Default Table and Report Columns in QuickbaseHow to Organize & Assign Groups to Quickbase ReportsHow to Link Dashboards Together in QuickbaseHow to Create Reports and Charts in QuickbaseHow to use Rich Text to Make your Quickbase Dashboard Dynamic Using Report Formulas as a Filter in a Report in QuickbaseHow to Create a Kanban Report in QuickbaseHow to Organize and Assign Groups to Quickbase ReportsHow to Use Report Formulas as a Filter in a Quickbase ReportUnderstanding and Setting Up Subscription Emails in Quickbase How to Create an Audit or Change Logs with Automations How to Create a Pie Chart in QuickbaseHow to Build Standard Reports in QuickbaseSections
How to Add a Report to your Quickbase Dashboard
Adding reports to a Quickbase dashboard enhances the dashboard’s value by turning raw data into meaningful, actionable insights. Reports provide the detail, trends, and visual analysis that help users monitor performance and take action quickly.
Key benefits of Adding Reports to a Quickbase Dashboard
Real-Time Data Insights
Reports automatically pull live data from Quickbase tables, ensuring users always see the most current information available.
Improved Visibility into Operations
Reports allow teams to monitor:
- Project progress
- Task completion
- Budget status
- Sales activity
- Resource utilization
- Workflow bottlenecks
This creates transparency across departments and projects.
Faster Decision-Making
Visual reports such as charts, tables, pipelines, and summaries help users quickly interpret data and make informed decisions without manually analyzing spreadsheets.
KPI Tracking in One Place
Dashboards with reports allow organizations to track key performance indicators (KPIs) such as:
- Revenue goals
- Open issues
- Project deadlines
- Customer response times
- Utilization rates
Custom Views for Different Users
Reports can be customized based on role or responsibility:
- Executives view high-level metrics
- Managers track team performance
- Staff monitor daily tasks and priorities
Easier Trend Analysis
Charts and historical reports help identify:
- Performance trends
- Process inefficiencies
- Growth opportunities
- Recurring issues
This supports continuous improvement initiatives.
Increased Accountability
Reports make ownership and status visible, helping teams stay accountable for deadlines, deliverables, and operational goals.
Automated Reporting
Instead of manually creating reports, Quickbase dashboards automatically refresh data, saving time and reducing reporting errors.
Better Workflow Management
Reports can highlight overdue items, stalled approvals, incomplete tasks, or exceptions requiring immediate attention.
Enhanced User Experience
A dashboard with organized reports gives users a centralized, easy-to-navigate workspace rather than forcing them to search through multiple tables or applications.
Examples of Useful Dashboard Reports:
- Open vs. completed tasks
- Project health status
- Budget tracking reports
- Sales pipeline reports
- Resource allocation charts
- Compliance tracking
- Customer support metrics
- Approval queue summaries
In short, reports make Quickbase dashboards more powerful by transforming operational data into clear, visual, and actionable business intelligence.
How to Add a Report to your Quickbase Dashboard?
To start adding reports, you will have to get to the ‘edit’ screen for the particular dashboard you want to modify in one of two ways.
- If you are already on the dashboard you want to make changes to, click the ‘Customize This Page’ link in the right corner of your page
- You can skip to step (5) if this is the case
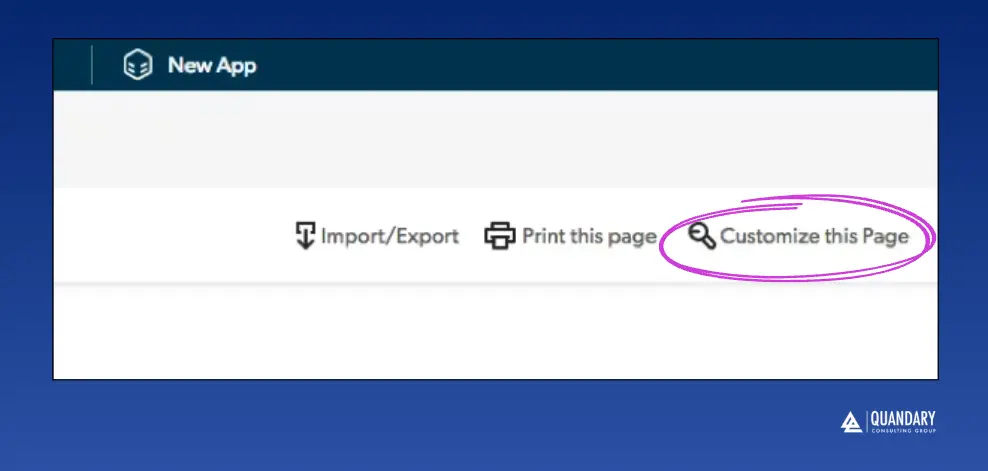
- If you are not already on the dashboard you want to make changes to, click the ‘Settings’ gear icon from the Home Screen of your application and follow the steps below.
- Select the ‘Pages’ link under the ‘User Interface’ column of the settings page
- Click the link of the particular Page you want to make changes to
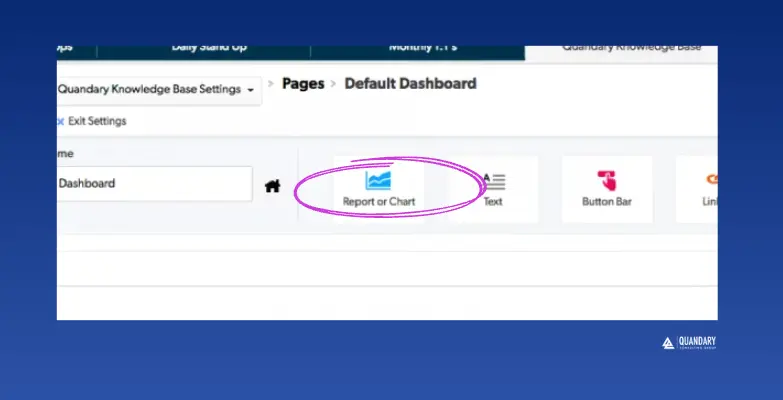
- From the edit page of the Dashboard – hover over the ‘Report or Chart’ icon at the top of the page
- Click and drag the icon into the white area of the page, move it around until you find the place you want to drop it, then un-click.
- A new empty report widget will be added (see image below) on the page where you dropped it.
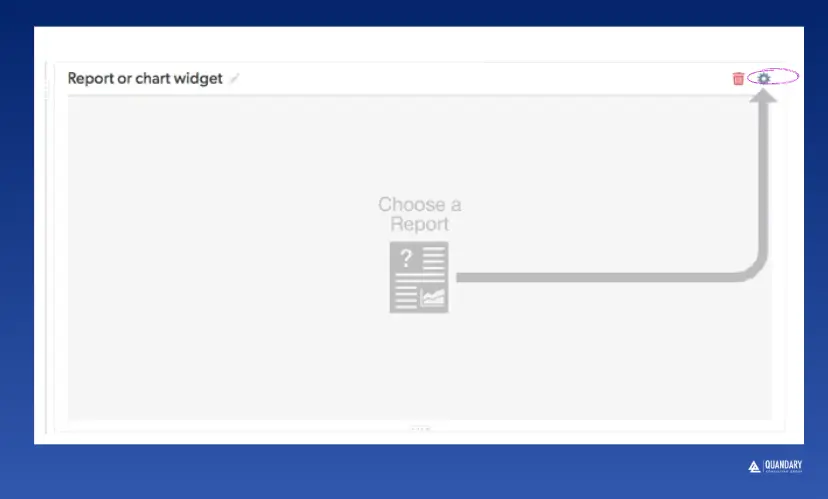
- On your new report widget – click the gear icon where the arrow is pointing. You will be presented with a drop-down list similar to below.
- Search and locate the report you want to place here, select it, and watch the report load on your dashboard.
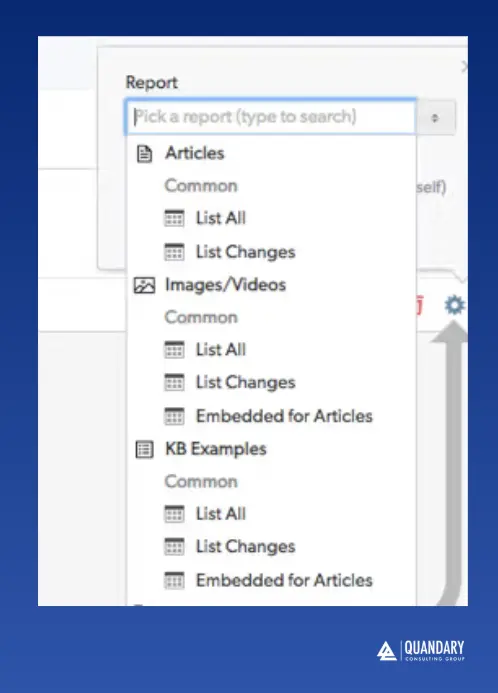
By default, Quickbase will title this widget with the report name – see the ‘List All’ title on the report widget above.
- To change the title, hover your mouse next to the title, where a Pencil Icon will appear.
- Select the Pencil and enter in the new title you would like to label this widget as to ensure it makes sense to your users.
- Repeat these steps to add additional reports that you want to appear on this dashboard.
- When you are done, make sure to ‘Save’ the dashboard in the upper right-hand corner.
Considerations to Note:
- A ‘Grid Edit’ type report cannot be placed on a dashboard.
- There is a limit of 9 report widgets per dashboard
- You cannot use a Personal Report on a dashboard.
- Incomplete Reports, meaning any of those that have an ‘ask the user’ component, cannot be used on Dashboards.
- Author: Logan Lott
- Title: Solution Consultant | Quickbase
- Email: llott@quandarycg.com
- Date Updated: April, 4, 2026
Top 10 FAQs About Adding Reports to a Quickbase Dashboard
1. What are the benefits of adding reports to a Quickbase dashboard?
Adding reports to a Quickbase dashboard helps businesses centralize real-time data, improve visibility into operations, and make faster data-driven decisions. Reports provide visual insights through charts, graphs, and tables that help teams track KPIs, project progress, budgets, workflows, and performance metrics in one location.
Organizations use Quickbase dashboard reports to improve productivity, reduce manual reporting, and increase operational transparency across departments.
2. How do Quickbase dashboard reports improve business decision-making?
Quickbase dashboard reports improve decision-making by providing live operational data and visual analytics in real time. Business leaders can quickly identify trends, bottlenecks, overdue tasks, budget issues, and workflow inefficiencies without manually reviewing spreadsheets or disconnected systems.
Custom reports also allow teams to prioritize critical actions faster and respond proactively to business challenges.
3. Can Quickbase dashboards display real-time reports?
Yes. Quickbase dashboards can display real-time reports that automatically update as records change within the application. This ensures users always have access to current information for projects, operations, sales pipelines, resource management, compliance tracking, and more.
Real-time reporting helps organizations improve accuracy and eliminate outdated data.
4. What types of reports can be added to a Quickbase dashboard?
Quickbase dashboards support multiple report types, including:
- Summary reports
- Table reports
- Charts and graphs
- Calendar reports
- Pipeline reports
- KPI scorecards
- Kanban-style workflow reports
These reporting options help businesses visualize operational performance and monitor key metrics more effectively.
5. How do Quickbase reports help improve operational efficiency?
Quickbase reports streamline operations by automating data tracking, reducing manual reporting tasks, and providing centralized visibility into workflows. Teams can quickly identify delays, bottlenecks, overdue tasks, and resource constraints through dashboard reporting.
This allows businesses to improve accountability, optimize processes, and increase productivity across departments.
6. Are Quickbase dashboard reports customizable?
Yes. Quickbase dashboard reports are highly customizable based on business needs, user roles, and operational goals. Organizations can configure filters, permissions, visual layouts, KPIs, charts, and report views for executives, managers, and employees.
Custom dashboards help each user focus on the data most relevant to their responsibilities.
7. How do Quickbase dashboards support project management?
Quickbase dashboards support project management by providing centralized reporting for task tracking, timelines, budgets, risks, approvals, and team workloads. Project managers can monitor project health in real time and quickly address delays or resource issues.
Dashboard reports improve collaboration and ensure stakeholders stay aligned throughout the project lifecycle.
8. Can Quickbase reports help with compliance and auditing?
Yes. Quickbase reports help organizations monitor compliance requirements, approval workflows, audit trails, and regulatory documentation. Dashboards can display overdue approvals, missing documentation, compliance gaps, and process exceptions in real time.
This improves governance, reduces risk, and supports audit readiness.
9. Why are visual reports important in a Quickbase dashboard?
Visual reports make complex business data easier to understand and analyze. Charts, graphs, gauges, and KPI widgets allow users to identify trends and performance issues quickly without reviewing raw data manually.
Visual dashboards improve communication during meetings, executive reviews, and operational planning sessions.
10. How can a Quickbase consulting partner help optimize dashboard reporting?
A Quickbase consulting partner, like Quandary Consulting Group, can help businesses design scalable dashboards, build custom reports, automate workflows, and optimize data visualization for better business intelligence. Consultants also ensure dashboards align with operational goals, user needs, and reporting best practices.
Professional Quickbase implementation services help organizations maximize ROI, improve reporting accuracy, and accelerate digital transformation initiatives.
To see how Quandary Consultant Group can help with your Quickbase development or implementation, please reach out to us and schedule a free discovery session!


Industries
Resources


© 2026 Quandary Consulting Group. All Rights Reserved.
Privacy Policy