
Knowledge Base
Articles In This Section
Quickbase Login Issues: Common Causes and Troubleshooting GuideHow to Optimize Storage and Archiving for High-Volume Quickbase EnvironmentsSections
How to Optimize your Quickbase for Faster Performance
If your Quickbase app is running slower than expected, it can disrupt workflows, reduce productivity, and create frustration for users. Performance issues may show up as long page load times, delayed reports, or sluggish form interactions, often caused by factors like large data volumes, complex relationships, inefficient formulas, or heavily customized dashboards.
This article outlines common causes of slow performance in Quickbase and provides practical steps to diagnose and improve the speed and responsiveness of your applications.
10 Common Causes of Slow Performance in Quickbase
1. Large Data Volumes
As record counts grow, Quickbase apps can slow down—especially when tables contain tens or hundreds of thousands of records. Reports, searches, and queries take longer to process without proper filtering or archiving strategies.
2. Complex Relationships and Schema Design
Apps with many interconnected tables, multiple relationship layers, or excessive summary fields can create performance bottlenecks. Each relationship adds processing overhead, particularly in large or highly relational apps.
3. Inefficient Formulas and Fields
Overly complex formulas, especially those referencing multiple fields or tables, can slow down calculations. Excessive fields on a table (even unused ones) can also impact performance.
4. Heavy Reports and Dashboards
Reports that pull large datasets, include many columns, or rely on complex filters and calculations can load slowly. Dashboards with multiple embedded reports amplify this issue.
5. Overuse of Summary Fields
Summary fields recalculate frequently and can significantly impact performance, especially in apps with high data volume or frequent updates.
6. Excessive Automations and Pipelines
Too many real-time automations, pipelines, or webhooks can slow down app responsiveness. Background processes competing for resources may delay user-facing actions.
7. Frequent API Calls and Integrations
Heavy use of APIs or integrations that constantly read/write data can strain performance, particularly if they run on short intervals or process large batches.
8. Poorly Optimized Filters and Queries
Reports or searches without proper filtering force Quickbase to scan large datasets. Lack of selective filters or indexed fields increases load times.
9. Too Many Fields on Forms
Forms with a large number of fields (especially lookup or formula fields) can become sluggish, leading to slower load and save times for users.
10. Lack of Data Maintenance
Failing to archive old data, remove unused fields, or clean up outdated reports can gradually degrade performance over time.
How to Use the Quickbase Performance Bar to Find Optimization Issues
Using the Quickbase performance bar, you can monitor system performance as you work in Quickbase. Use this tool to see data about things that might affect performance.
If you experience slow performance of any kind, the information delivered by the performance bar can help you determine whether the problem originates with:
- Your browser
- The Quickbase service
- Your own network connection
How to Enable the Quickbase Performance Bar
Application administrators can enable the Quickbase performance bar and make it available for all application users. Once the performance bar is enabled, applications users can choose to show or hide it.
To enable the performance bar:
- From the app Home page, click Settings.
- Click App properties, then click Advanced Settings to expand the section.
- Under Performance options, click Show performance bar.
- Click Save.
How to Show or Hide the Quickbase Performance Bar
If the application administrator enables the performance bar for the application, all application users can choose to hide or show it by clicking More > Show Quickbase Performance Bar on the app Home page.
- You can also hide the performance bar by clicking the X on the left side of the bar.
- When you show the performance bar, it displays at the bottom of your screen while you work in any application.
- If you log out while it is displayed, it remains visible the next time you sign in.
- If you hide the bar, it remains hidden while you work in any application. If you log off while it is hidden, it remains hidden the next time you sign in.
How to Understand your Performance Data in Quickbase
The Quickbase performance bar displays information about your browser, the Quickbase server response time, and your network download speed.
Quickbase Browser Information
The performance bar detects and displays your browser version. Since newer browsers have better support for CSS and JavaScript, using an older browser could be the source of some performance problems.
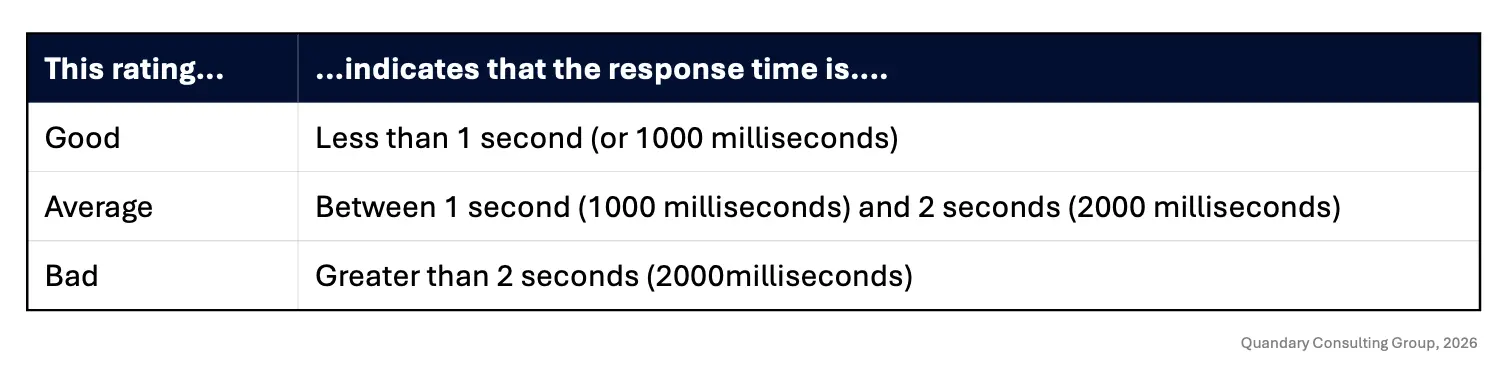
Quickbase Response Time
The performance bar displays the Quickbase server response time. You'll see the server response time speed displayed in seconds (rounded to the next 1/100 of a second).
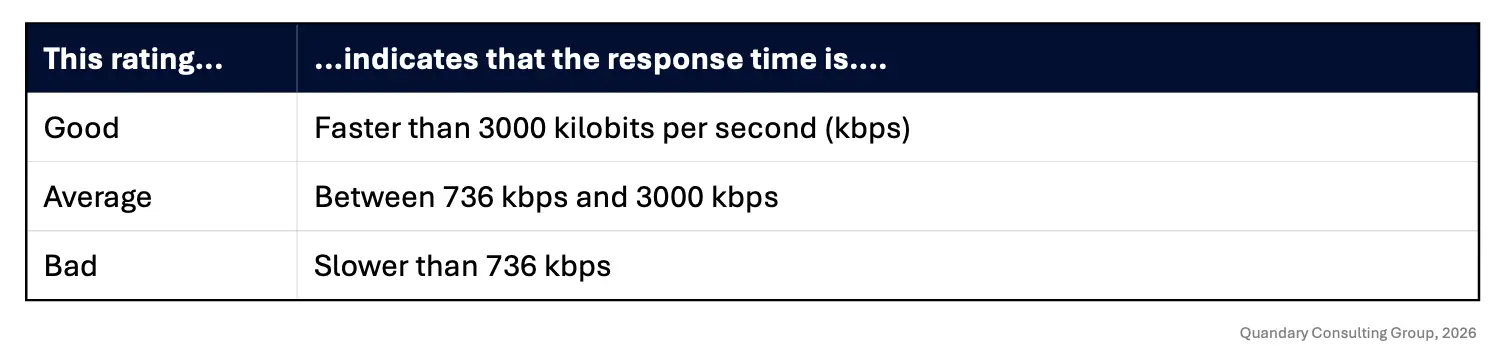
Network Speed
You can ask the performance bar to check out the speed of your own network connection.
When you click [Run Network Test], the performance bar displays the speed at which data is downloaded from the Internet to your network (in kilobits per second).
You'll see the following ratings:
How to Email your Performance Data to your Quickbase Application Manager
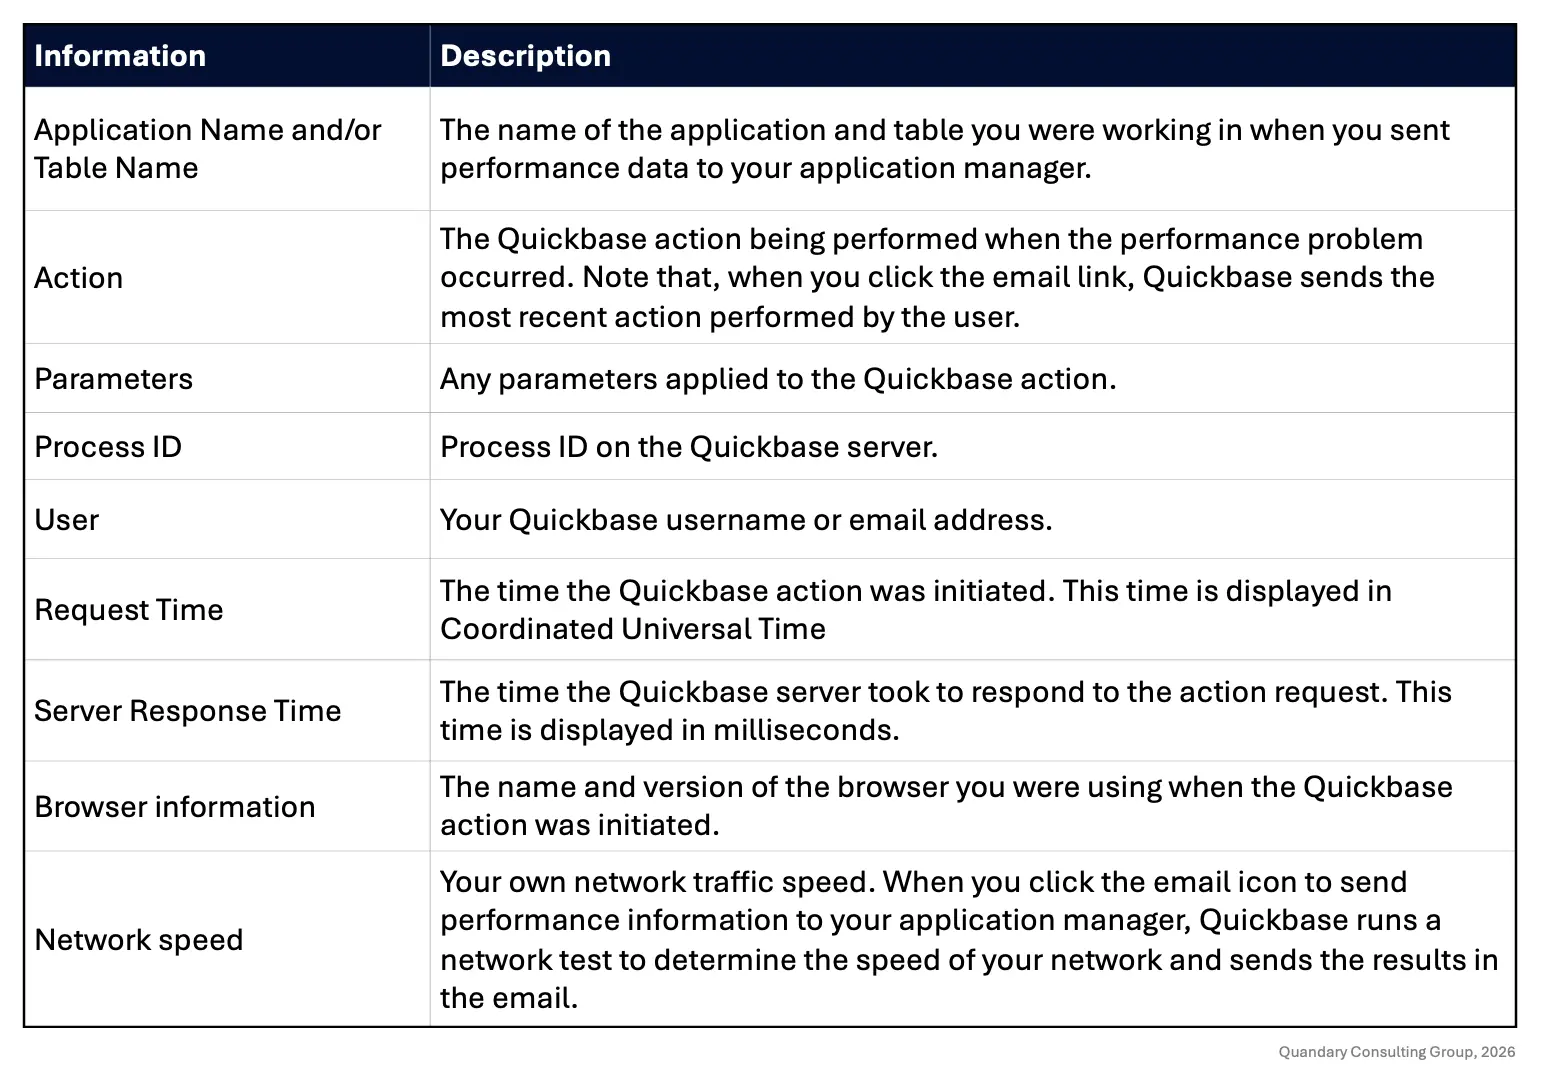
If you experience slowness of any kind while you're working in a Quickbase application, you may want some help in diagnosing the problem. You can easily send a snapshot of your Quickbase system performance to your application manager.
If you click the email icon in the performance monitor, you can send the following information:
How to Use Quickbase's Performance Analyzer
Once you suspect an app performance issue, the Quickbase Performance Analyzer is your next stop.
Enable Quickbase Performance Analyzer:
- Go to your app experiencing slowness, then:
- Navigate to App Settings > App management > Performance Analyzer.
- Click the, Start Performance Analyzer, button.
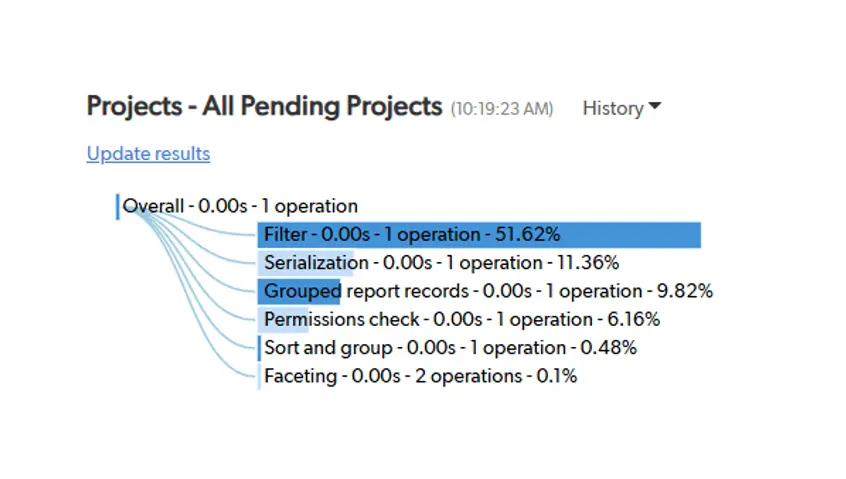
Open Quickbase Visualizer:
- The performance will show results on each action took and show the total time for each individual process.
- This breaks down the processes involved and how Quickbase is handling each.
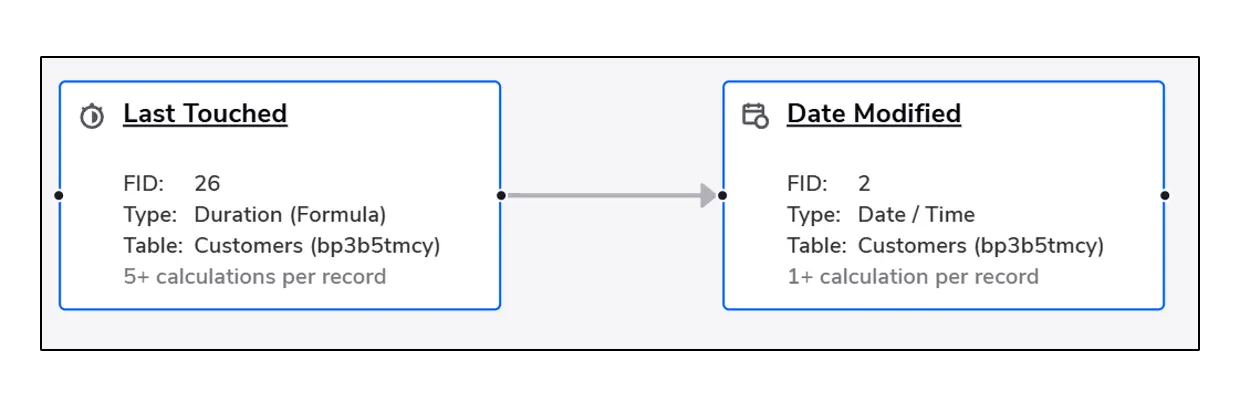
How to Analyze Formula Complexity with the Quickbase Dependency Diagram
If the Quickbase Performance Analyzer shows that a specific field is taking a long time to calculate, use the Dependency Diagram to see why.
Open the Diagram:
- Go to Settings > Tables > [Select your Table] > Fields.
- Find the slow field and select the Dependency Diagram icon (looks like a flowchart).
Activate the Hot Path:
- Click the Fire Icon in the diagram toolbar.
- This highlights the Hot Path —the specific fields or calculations that contribute to more than 20% of the total calculation load.
Check your Quickbase Calculation Counts:
- Look at the numbers on the nodes.
- If a field has a high Calculation Count (e.g., 50+) this means every time that field is used, Quickbase is doing a massive amount of background work.
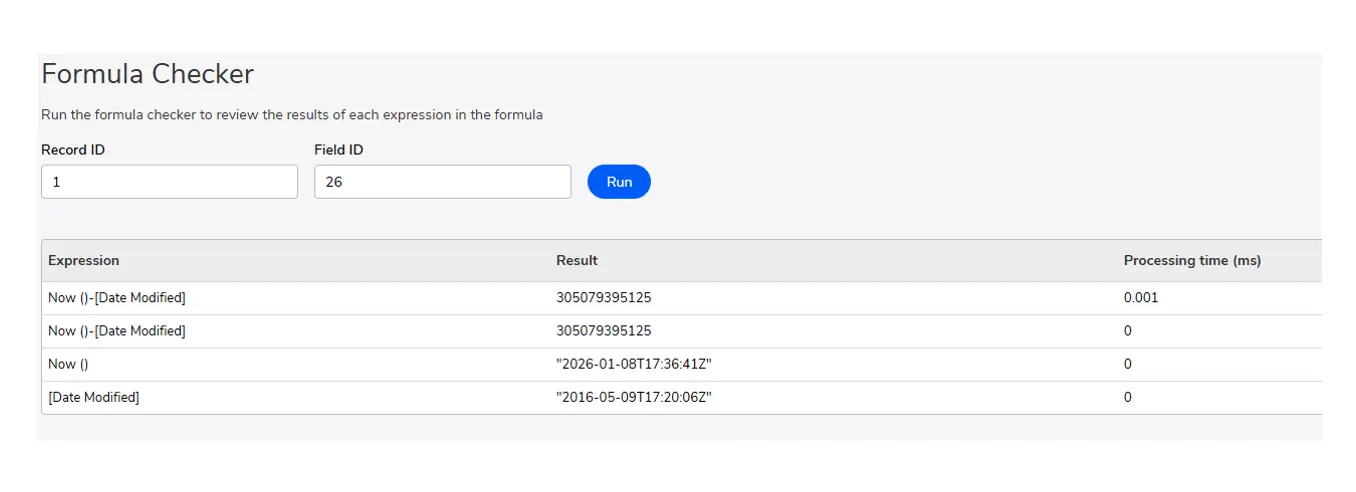
How to Run a Deep-Dive with Quickbase Formula Checker
For extremely complex formulas, use the Quickbase Formula Checker to see the processing time for every single line of code.
Test the Formula:
- Within the field settings of a formula field, look for the Formula Checker section.
Input a Record ID:
- Enter a valid Record ID from your table and click Check Formula.
Identify Bottlenecks:
- The tool will return a list of every expression evaluated.
- Look for specific lines where the time (in milliseconds) jumps significantly.
- These are the parts of your formula you should simplify or replace with a summary field.
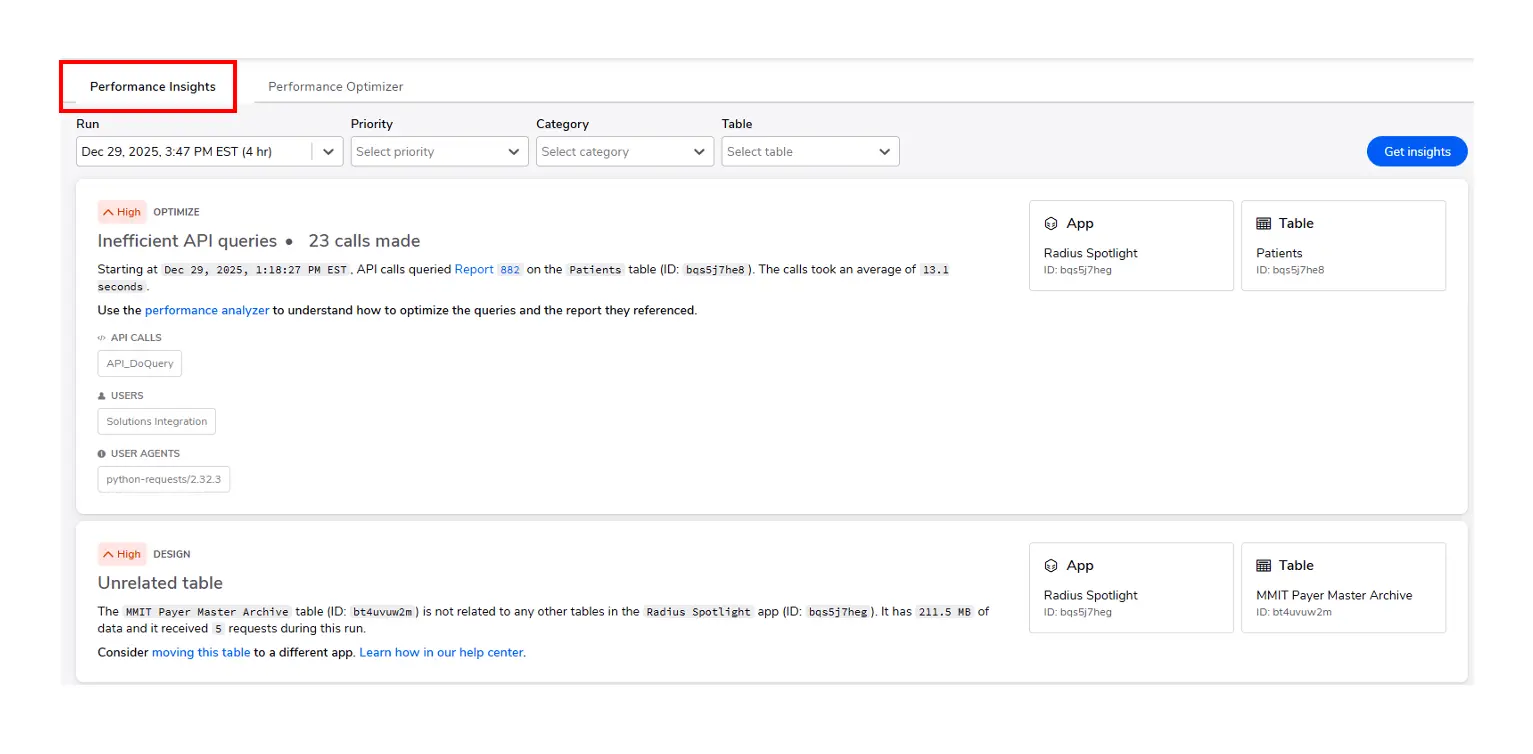
How to Audit Quickbase Performance Insights and Optimizer
If you are an Enterprise Quickbase user, you can audit the entire Quickbase app at once rather than checking individual fields.
Run a Scan:
- Navigate to the Performance Insights tab in your Quickbase App Settings.
Select a Duration:
- Choose a window (e.g., 'within the last 1 hour', etc.) to analyze all user traffic.
Review Recommendations:
- Quickbase will group issues into High, Medium, and Low priority.
- It might suggest, 'Adding report caching', or 'Refactoring an API call', that is hitting the server too frequently.
Quickbase Performance Insights:
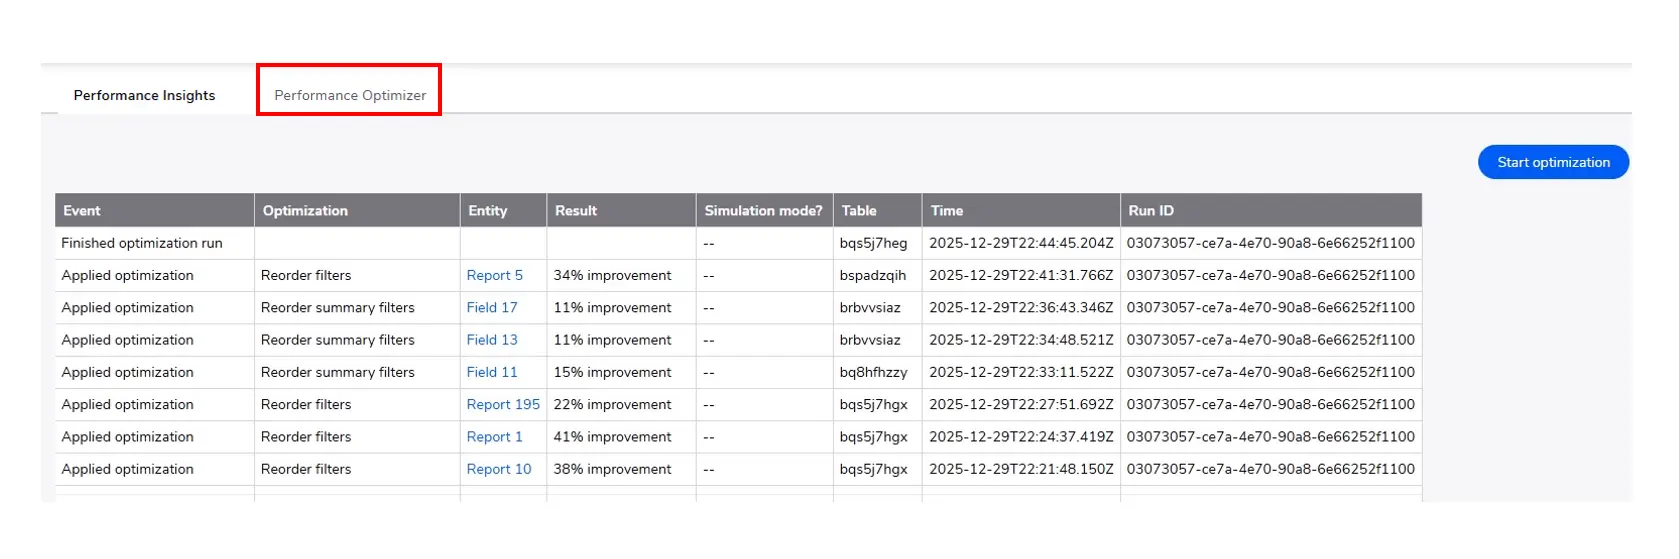
Quickbase Performance Optimizer:
- The Quickbase Performance Optimizer performs a scan of the application, allowing the user to optimize in Sandbox Mode or allow the Quickbase Performance Optimizer to improve the efficiencies it outlines as suggests.
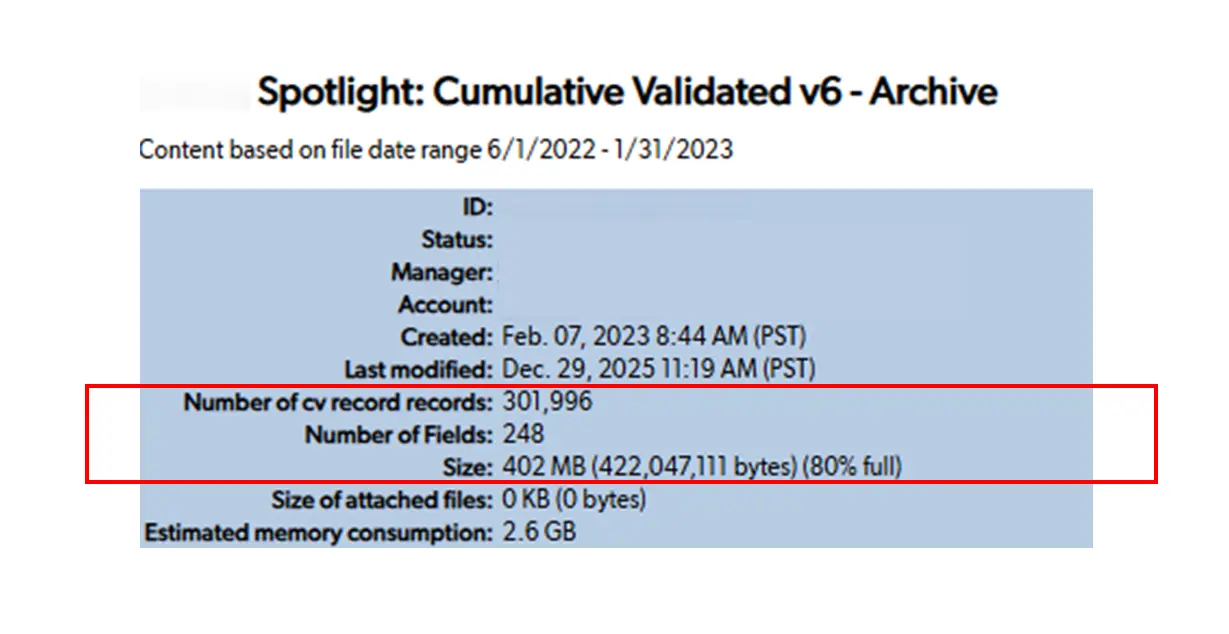
Additional Insights
Evaluating the memory of tables and app size limits provides insights to allow for proactive approaches in archiving data into historical apps or historical tables to provide better efficiencies in Quickbase.
This can be found in the App Management > Show App Statistics.
Typical table size limits are 500 MB and once filled up the table will no longer store data, which then requires the app to be refactored.
Quickbase Application Checklist
Check the "Evaluate only when data has changed" box, in the settings of your most complex formula fields.
Limit Sorting:
Make sure to not sort or group reports by complex formula fields or formula-URL fields.
Optimize Filters:
Ensure your most restrictive filters (e.g., "Status is Open") are at the top of the report filter list.
Archive Old Data:
If a table has over 500,000 records, consider archiving old data to a separate "History" app for record keeping.
- By: Logan Lott
- Title: Solution Consultant | Quickbase
- Email: llott@quandarycg.com
- Date: April 15, 2026
FAQs: How to Quickbase Optimize Slow Performance
1. Why is my Quickbase app running slow?
Quickbase apps often run slow due to large data tables, complex formulas, too many relationships, or unoptimized reports and dashboards.
Performance can also be impacted by excessive fields, heavy pipelines, or frequent API calls. Identifying these bottlenecks is the first step to improving speed.
2. How can I improve Quickbase performance quickly?
To improve Quickbase performance, start by reducing unnecessary fields, simplifying formulas, limiting report complexity, and archiving old data.
Optimizing table relationships and minimizing real-time automations can also significantly speed up your app.
3. What are the most common Quickbase performance issues?
Common Quickbase performance issues include slow report loading, delayed form submissions, large record volumes, inefficient queries, and overuse of summary fields.
Poor app design and lack of indexing can also contribute to slow performance.
4. Does data size affect Quickbase performance?
Yes, large datasets can significantly impact Quickbase performance.
As record counts grow, reports, searches, and calculations take longer to process. Regular data cleanup, archiving, and using filtered reports can help maintain optimal performance.
5. How do I troubleshoot slow Quickbase reports and dashboards?
To troubleshoot slow Quickbase reports, review filters, reduce the number of displayed fields, avoid complex calculations, and limit joins across multiple tables.
Breaking large reports into smaller, focused views can also improve load times and user experience.

Industries
Resources


© 2026 Quandary Consulting Group. All Rights Reserved.
Privacy Policy