
Knowledge Base
Articles In This Section
What Are Quickbase Dashboards How to Set Up Personalized Dashboards in QuickbaseHow to Create a Dashboard in QuickbaseHow to add a Webpage Widget (embedded iFrame) to your Quickbase DashboardHow and When to Use Calculated Columns for Quickbase Reports How to Create a Summary Report in QuickbaseHow to Utilize the Dashboard Side Bar in QuickbaseHow to Build an Operations Dashboard in Quickbase How to Color-Coding Rows for Quickbase Reports Using Automations to Log Approval Time and User in QuickbaseHow to Create External Stakeholder Forms, Reports, and Dashboards in QuickbaseHow to Update the Default Table and Report Columns in QuickbaseHow to Organize & Assign Groups to Quickbase ReportsHow to Link Dashboards Together in QuickbaseHow to Create Reports and Charts in QuickbaseHow to use Rich Text to Make your Quickbase Dashboard Dynamic How to Create a Kanban Report in QuickbaseHow to Automate Approval Tracking in QuickbaseHow to Organize and Assign Groups to Quickbase ReportsHow to Use Report Formulas as a Filter in a Quickbase ReportHow to Create Subscription Emails in QuickbaseHow to Create an Audit or Change Logs with Automations How to Create a Pie Chart in QuickbaseHow to Build Standard Reports in QuickbaseHow to Add a Report to your Quickbase DashboardSections
Using Report Formulas as a Filter in a Report in Quickbase
A calculated column (recently renamed ‘Report Formulas’) can be added to any Quick Base report. The report formula is similar to a formula field, but is added as a column to your report and can only be used within the confines of the report where it was created. If you not familiar with Report Formulas, click here for a brief background.
If you’re familiar with Report Formulas you already know they can be used to; Calculate total costs, display images, return a boolean depending on if a criteria is met and more. But did you know that Report Formulas can also be added to your report filters?
So what are some good examples where we might use Report Formulas in a report filter? The applications are fairly wide-ranging. Here are just a few examples:
✓ Extract months from dates to allow users to filter by a particular month
✓ Categorize companies into ‘High’, ‘Med’ and ‘Low’ based on sales for report filtering
✓ Determine if an invoice is at risk for non-payment given multiple factors
Let’s look more closely at our first example: _Extract months from dates to allow users to filter by a particular month. In this scenario we’ll use a formula to determine the month of each of our project start-dates. Then we will use the results of the formula to filter for Projects starting in the month of February.
Currently our report looks like this:
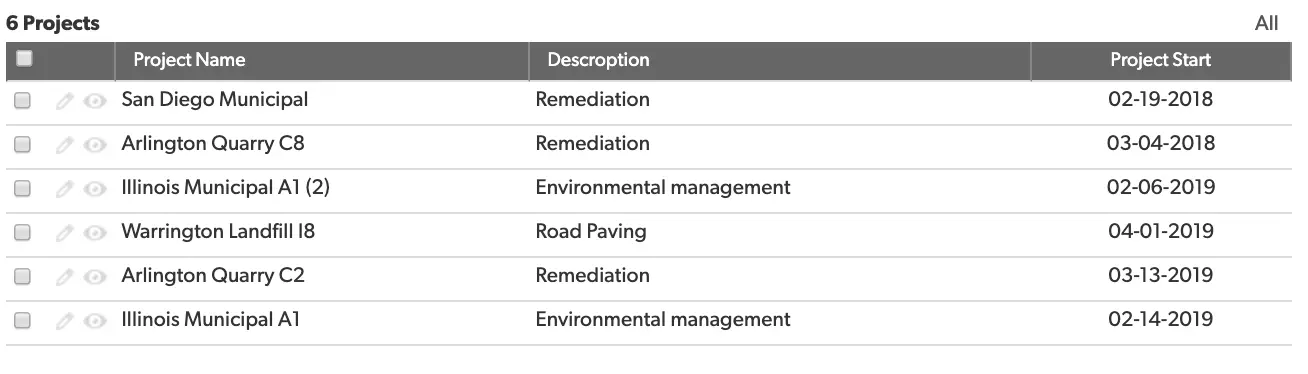
If we wanted to see all the projects starting in February 2019 we could easily set a filter within the report that looked like this:
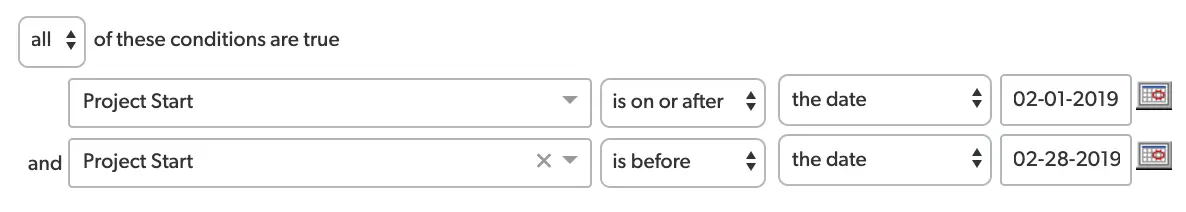
However, if I expand this filter to look as far back as 2010, I’ll have to add similar filters an additional 8 times (one for each year). Creating a Report Formula and using it as a filter presents a better option.
To setup our Report Formula and Report Filter, take the following steps:
- Click ‘Customize this report’
- Now we’ll scroll to the middle of our report settings ‘Report Formulas’ and click ‘Add a report formula’
- In the resulting formula box enter the following formula:
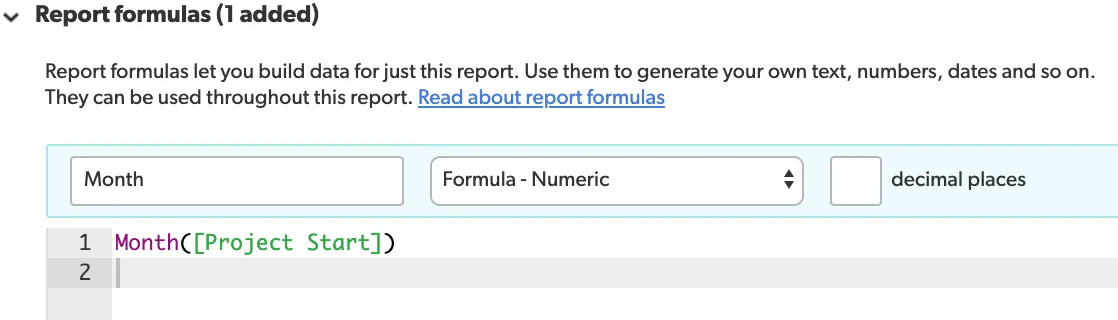
Make sure to name your formula (in this case we’ve named it ‘Month’). Then set your formula type to ‘Formula – Numeric.
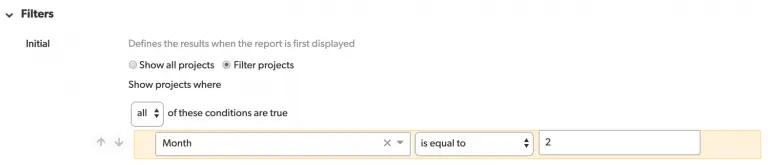
- Once you’ve finished constructing your formula, scroll down to the ‘Filters’ portion of your report settings. Select the formula you just created in the fields dropdown and set it equal to ‘2’. Your filter should look like this:
Our report will now only show projects with a start date in February. Click ‘Save’
- Returning to your report, it should look something like this:
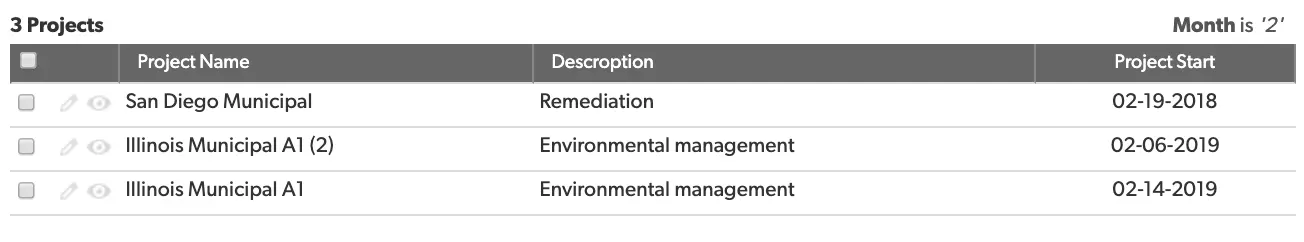
Notice that with our one formula added as a filter, we were able to see all projects starting in February, regardless of year, with just one filter.
For our introduction to ‘Calculated Columns/Report Formulas’ click here. For all our articles on Fields and formulas click here.
- Author: Jake Rattner
- Email: jrattner@quandarycg.com
- Date Submitted: 4/17/2019

Industries
Resources


© 2026 Quandary Consulting Group. All Rights Reserved.
Privacy Policy