
Knowledge Base
Articles In This Section
What Are Quickbase Dashboards How to Set Up Personalized Dashboards in QuickbaseHow to Create a Dashboard in QuickbaseHow to add a Webpage Widget (embedded iFrame) to your Quickbase DashboardHow and When to Use Calculated Columns for Quickbase Reports How to Create a Summary Report in QuickbaseHow to Utilize the Dashboard Side Bar in QuickbaseHow to Build an Operations Dashboard in Quickbase Using Automations to Log Approval Time and User in QuickbaseHow to Create External Stakeholder Forms, Reports, and Dashboards in QuickbaseHow to Update the Default Table and Report Columns in QuickbaseHow to Organize & Assign Groups to Quickbase ReportsHow to Link Dashboards Together in QuickbaseHow to Create Reports and Charts in QuickbaseHow to use Rich Text to Make your Quickbase Dashboard Dynamic Using Report Formulas as a Filter in a Report in QuickbaseHow to Create a Kanban Report in QuickbaseHow to Automate Approval Tracking in QuickbaseHow to Organize and Assign Groups to Quickbase ReportsHow to Use Report Formulas as a Filter in a Quickbase ReportHow to Create Subscription Emails in QuickbaseHow to Create an Audit or Change Logs with Automations How to Create a Pie Chart in QuickbaseHow to Build Standard Reports in QuickbaseHow to Add a Report to your Quickbase DashboardSections
How to Color-Coding Rows for Quickbase Reports
Drawing attention to critical details will save time and create action.
Some common scenarios that you might encounter where color coding rows in your report would be beneficial are:
✓ Highlight data that is “on track”
✓ Show attention to a problem
✓Ease of identifying action items
You can switch between three color-coding methods available in the report builder:
✓ Selecting colors
✓ Writing a formula
✓ Default color-coding
Color-Coding by Selecting Colors:
- Text – Including Multiple Choice and Multi-Select
- Components of an Address Field, like street or state
- Formula Text and Email
- Checkbox and Formula – Checkbox
- Open up a report you would like to start customizing and select the Customize this Report key icon from the upper right corner.

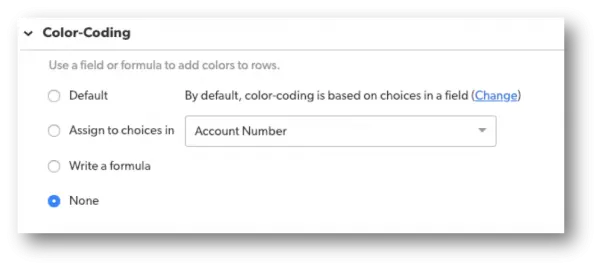
- Navigate towards the bottom of the report builder and locate section heading, Color-Coding.
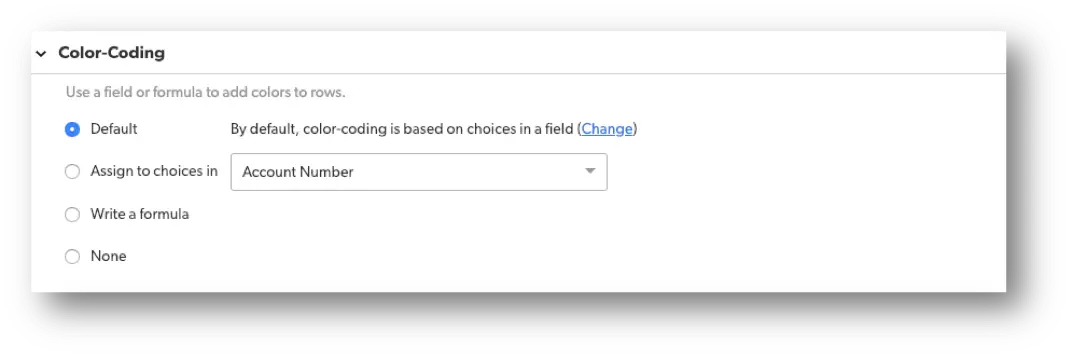
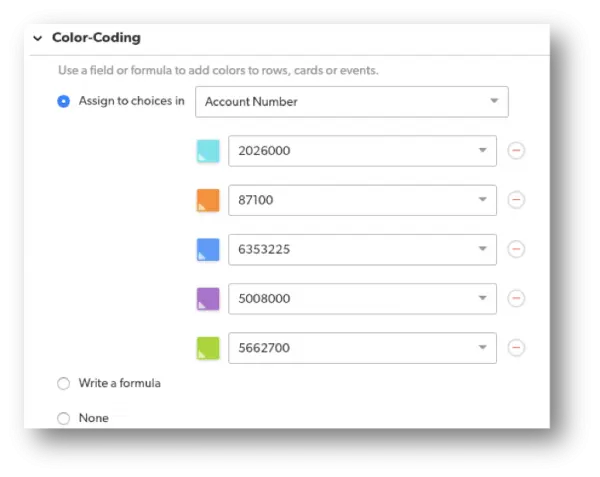
- In the Color-Coding Section of the report builder, select the radio button Assign to choices.
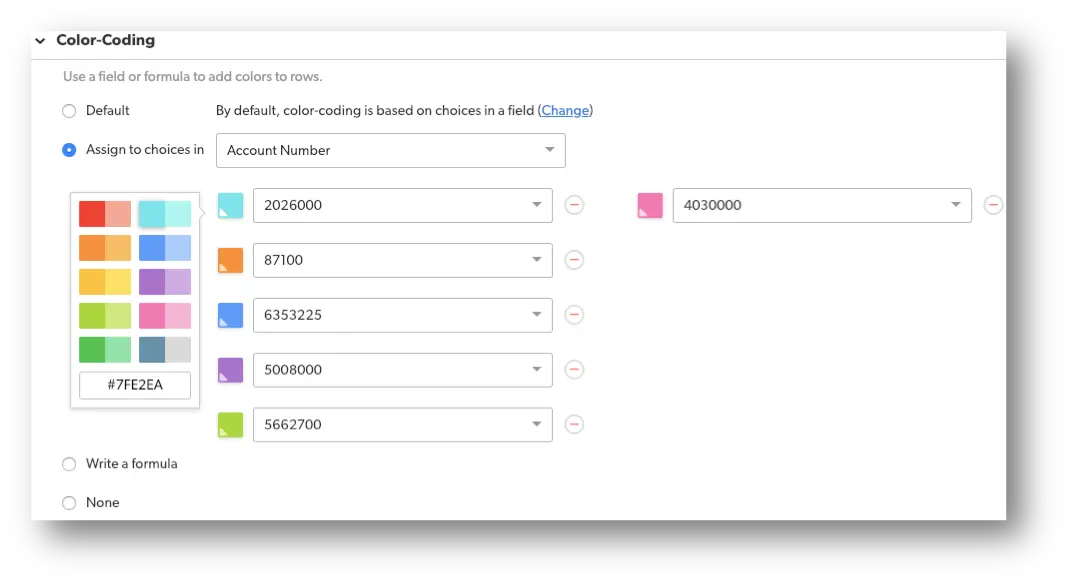
✓ Select the field you want to color-code. Quick base creates up to 10 unique color options.
✓ You can assign colors for any field values without a color – up to a maximum of 10 options.
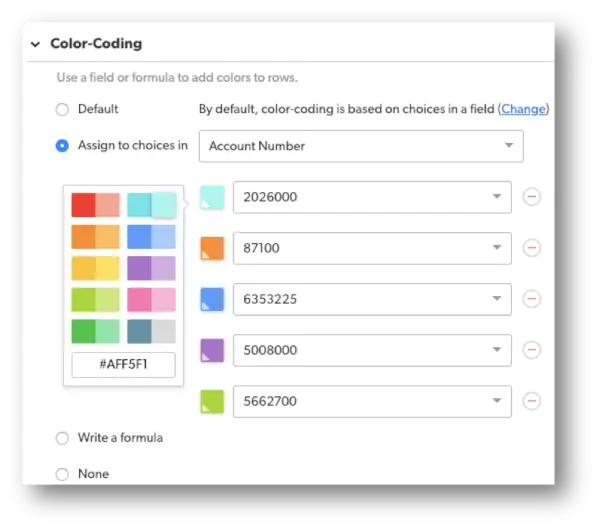
You can customize color assignments by:
✓ Selecting a different color from the color palette.
✓ Selecting a different field value from the drop down.
✓ Removing the color by selecting the Remove icon.
✓ Adding a color by selecting a field value, then selecting a color.
- Select Display to preview your work or select Save to save your work.
Color-coding by Writing a Formula:
Sometimes the built-in color-coding rules in Quick Base don’t go quite far enough. Adding your own colorization formula can use conditional logic based on multiple fields to provide a power boost to help you do things the built-in rules can’t do.
- Navigate to the upper right corner and select the Customize this Report key icon.
- Navigate towards the bottom of the report builder and locate section heading, Color-Coding.
- In the Color-Coding section of the report building, select Write a formula.
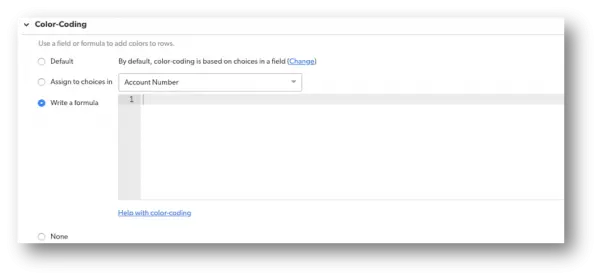
✓ In the formula editor, enter a formula that defines color assignments.
✓ The formula input must tell Quick Base the conditions needed to assign a color. In most cases, formulas use IF or CASE statements to define the conditions.
✓ The formula must return the colors as text in HTML color names like “Blue,” or “Orange.”
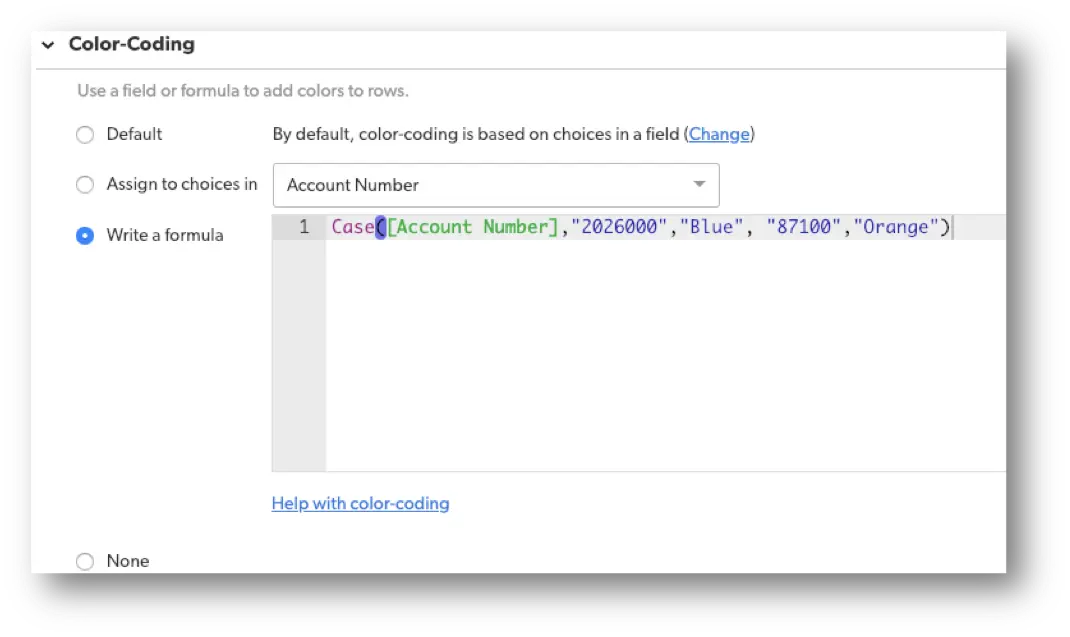
Here is an example of a simple colorization formula where any Account Numbers equal to “2026000” will be highlighted in Blue and Account Numbers equal to “87100” will be highlighted in Orange.
Before:
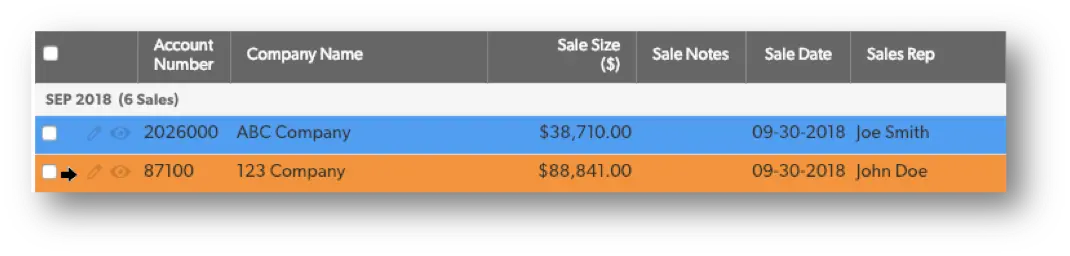
Result:
- Select Display to preview your work or select Save to save your work.
Specifying Default Color-Coding:
– BEST PRACTICE: Keep in mind, this option will change the coloring on all reports that are set to default color-coding, but it’s not best practice unless you want all reports to be color-coded initially.
- Navigate to the upper right corner and select the Customize this Report key icon.
- Navigate towards the bottom of the report builder and locate section heading, Color-Coding and select Default.
- Select the hyperlink Change in parentheses. This will redirect you to the Default Report Settings.
- Scroll down to the bottom of the page and under the Color-Coding section select Assign to choice in.
You can customize color assignments by:
✓ Selecting a different color from the color palette.
✓ Selecting a different field value from the drop-down.
✓ Removing the color by selecting the Remove icon.
✓ Adding color by selecting a field value, then selecting a color.
- Select Save.
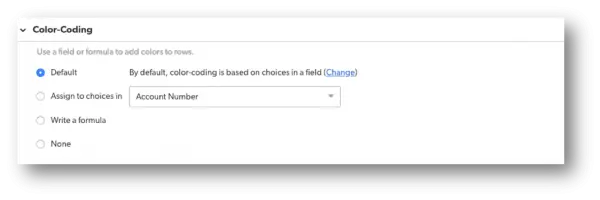
Removing Color-Coding:
- Navigate to the upper right corner and select the Customize this Report key icon.
- In the Color-Coding section of the report builder, select None.
- Select Save.
To learn more ways to customize your reports in Quick Base, check out more articles here: Reporting & Dashboards.
- Author: Alex Skudrovskis
- Email: askudrovskis@quandarycg.com)
- Date Submitted: 1/17/2019

Industries
Resources


© 2026 Quandary Consulting Group. All Rights Reserved.
Privacy Policy