
Knowledge Base
Articles In This Section
What Are Quickbase Dashboards How to Set Up Personalized Dashboards in QuickbaseHow to Create a Dashboard in QuickbaseHow to add a Webpage Widget (embedded iFrame) to your Quickbase DashboardHow to Create a Summary Report in QuickbaseHow to Utilize the Dashboard Side Bar in QuickbaseHow to Build an Operations Dashboard in Quickbase How to Color-Coding Rows for Quickbase Reports Using Automations to Log Approval Time and User in QuickbaseHow to Create External Stakeholder Forms, Reports, and Dashboards in QuickbaseHow to Update the Default Table and Report Columns in QuickbaseHow to Organize & Assign Groups to Quickbase ReportsHow to Link Dashboards Together in QuickbaseHow to Create Reports and Charts in QuickbaseHow to use Rich Text to Make your Quickbase Dashboard Dynamic Using Report Formulas as a Filter in a Report in QuickbaseHow to Create a Kanban Report in QuickbaseHow to Automate Approval Tracking in QuickbaseHow to Organize and Assign Groups to Quickbase ReportsHow to Use Report Formulas as a Filter in a Quickbase ReportHow to Create Subscription Emails in QuickbaseHow to Create an Audit or Change Logs with Automations How to Create a Pie Chart in QuickbaseHow to Build Standard Reports in QuickbaseHow to Add a Report to your Quickbase DashboardSections
How and When to Use Calculated Columns for Quickbase Reports
Calculated Columns in Reports – Background
A calculated column can be added to any Quick Base report. They can be used to create anything a normal formula field could. However, the new column is only defined within its report. It is not a field in the Quick Base table and cannot be added to other reports (except if you create a calculated column in another report and copy the formula).
This limitation is actually incredibly useful. Many times, a calculation only has to be performed once or it is only relevant for one report. It does not make sense to create a new formula field in the table if the formula will only be used on one report. If this inefficient practice is followed, eventually, there will be dozens of unnecessary, one-off formula fields that clutter up the field list of a table. Calculated columns are an convenient solution to get the information you need while not adding too many formula fields to a table.
Calculated Columns – Navigation
From any report, click the ‘Customize this Report’ in the top, right-hand corner.
✓ For Table, Grid Edit, and Timeline reports, scroll to the ‘Columns to Display’ section;
✓ For Kanban reports, scroll to the ‘Card Details’ section;
✓ For Summary reports, scroll to the ‘Summarize Data’ section;
✓ For Chart and Calendar reports, scroll to the ‘Options’ section;
✓ For the Map reports, scroll to the ‘Pin Details’ section.
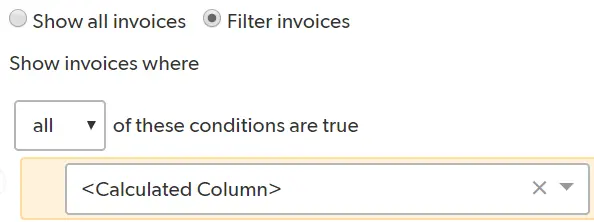
Once a calculated column has been made, it can be used any way a normal field in a report can: summarized, grouped, filtered, sorted, etc. The only additional limitation is the formula you write.
If you want to learn more about writing formulas, check out these two articles: Using If-statements in formulas and Using the CASE function
- Author: TJ Lawless
- Email: tlawless@quandarycg.com
- Date Submitted: 1/14/2018

Industries
Resources


© 2026 Quandary Consulting Group. All Rights Reserved.
Privacy Policy