Knowledge Base
Integrating Power BI with Quickbase
Quick Base has powerful reporting and visualization tools. However, this isn’t the primary function of Quick Base and, at times, you may need more sophisticated reporting than what Quick Base offers natively.
Power BI is one of the world’s most popular analytics tools because of its rich features, custom visualizations, advanced reporting and analytics tools. Fortunately for us, it is easy to integrate PowerBi with Quick Base so you can enjoy both together. These platforms can be connected in two important ways:
✓ The new Power BI connector for Quick Base allows you to stream data directly from your Quick Base app directly into Power BI at scheduled times throughout the day
✓ The reports and visualizations you create in Power BI can be embedded within Quick Base where you can view and interact with them.
We’ll look at how to do both starting with using the Power BI Connector. To do so you’ll need to have a Quick Base account as well as a Power BI account. If you’re not sure you’re ready to purchase Power BI you can use a 60-day free trial available from the Power BI Homepage.
To set up the Power BI Connector:
- Log into your Power BI Desktop Account
- Navigate to the section “Get Data” and select the Quick Base Connector:

- Enter your App url and User token in the resulting screens:

- Finally, select the tables you would like to access. Data will now stream to the desktop Power BI file. In order to schedule a refresh of the data in your online Power BI platform (Power BI Service), follow these steps:
- Open your Workspace
- Go to ‘My Workspace’ on the left panel and select the tab ‘Datasets’:

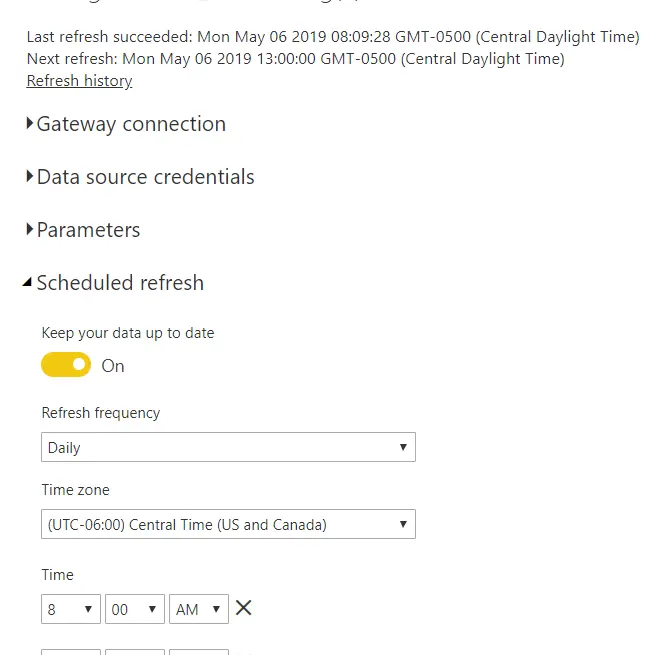
- Choose the dataset you’d like to refresh and click the ‘Schedule Refresh’ icon
- Now click into the scheduled refresh section and add a refresh time

Note: You can select multiple refresh times
With your data now refreshing automatically, its time for you to start creating visualization and reports in Power BI . There are a wealth of resources in Power BI for getting started. You can filter your data stream, make custom reports, plot your data on a map (Power BI has a fantastic GIS engine) and even apply advanced coding and calculations.
Once you have all your reports set up in Power BI , your users can login and view up-to-date reports any time. But what if you’d like to see all your information in one place within Quick Base? Power BI provides a few easy methods. Let’s see how:
- In Power BI Service (online), select a Workspace you’d like to embed
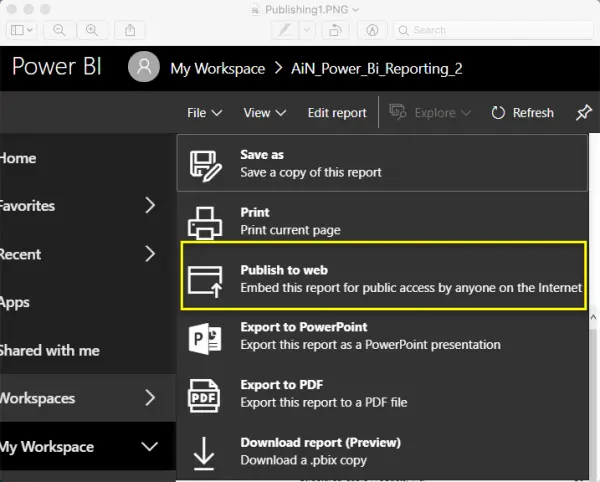
- In the file menu of that Workspace select ‘Publish to Web’ (Paid accounts will also have a secure ‘Embed’ option which requires sign-in credentials)

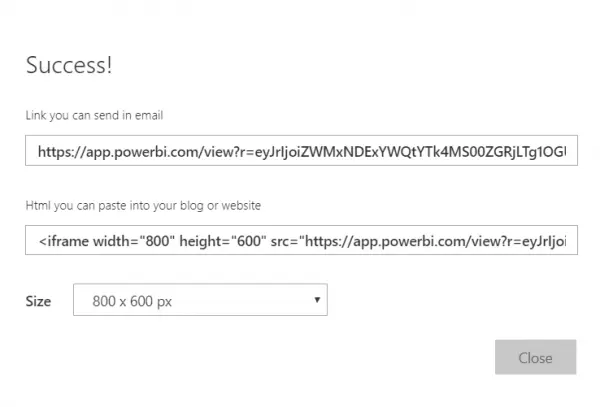
- From the resulting screen, copy the html url option (second box from top)

- With your url in hand, go to your Quick Base application where you would like to embed your data and go to the application dashboard where you’d like to embed your report
- Customize the dashboard page and add a ‘Webpage Widget’
- Enter your Power BI url into the Webpage Widget and press save
- Congratulations! You now have an automatically refreshed Power BI report within your Quick Base app
For more ‘Out of the Box’ ideas on how to use Quick Base click here
- Author: Jake Rattner
- Email: jrattner@quandarycg.com
- Date Submitted: 5/5/2019
Resources
© 2026 Quandary Consulting Group. All Rights Reserved.
Privacy Policy


